- Home >
- Stock Photos >
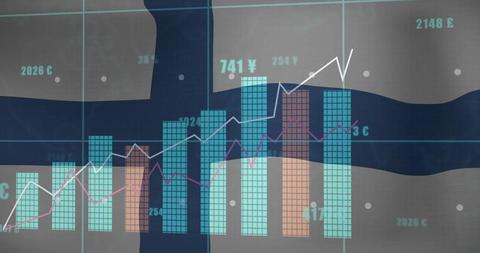
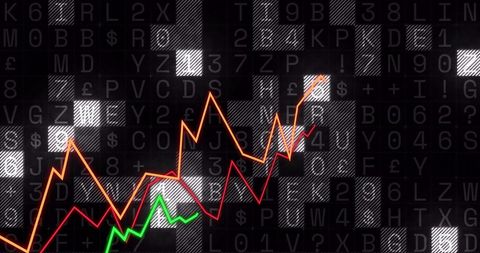
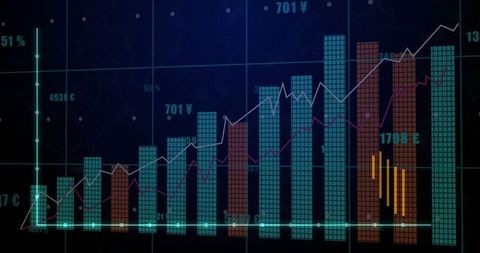
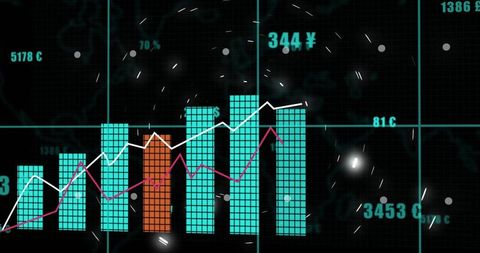
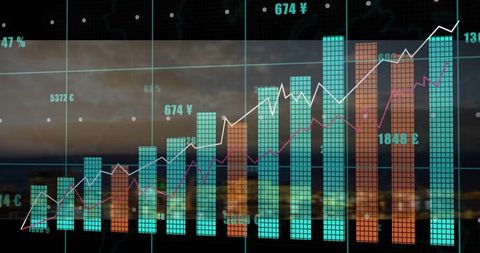
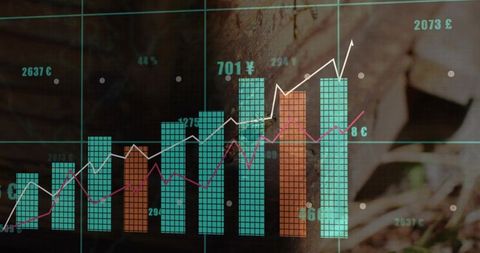
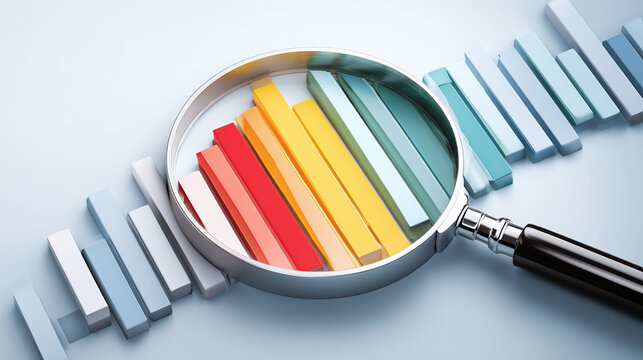
- Dynamic Financial Analysis and Data Visualization Dashboard
Dynamic Financial Analysis and Data Visualization Dashboard Image

Graphs and charts are essential financial analytics, showcasing digital data trends. Useful for presentations, reports, interactive dashboards, financial analysis, data comparison, decision making in businesses. Suitable for finance-related content, digital marketing, data visualization initiatives.
Powered by 


downloads
Tags:
More
Credit Photo
If you would like to credit the Photo, here are some ways you can do so
Text Link
photo Link
<span class="text-link">
<span>
<a target="_blank" href=https://pikwizard.com/photo/dynamic-financial-analysis-and-data-visualization-dashboard/25742d40568bfe521f9d84920f1b7a3a/>PikWizard</a>
</span>
</span>
<span class="image-link">
<span
style="margin: 0 0 20px 0; display: inline-block; vertical-align: middle; width: 100%;"
>
<a
target="_blank"
href="https://pikwizard.com/photo/dynamic-financial-analysis-and-data-visualization-dashboard/25742d40568bfe521f9d84920f1b7a3a/"
style="text-decoration: none; font-size: 10px; margin: 0;"
>
<img src="https://pikwizard.com/pw/medium/25742d40568bfe521f9d84920f1b7a3a.jpg" style="margin: 0; width: 100%;" alt="" />
<p style="font-size: 12px; margin: 0;">PikWizard</p>
</a>
</span>
</span>
Free (free of charge)
Free for personal and commercial use.
Author: Awesome Content