- Home >
- Stock Photos >
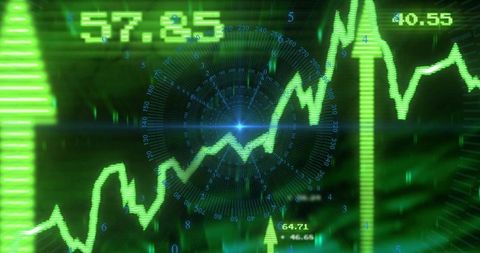
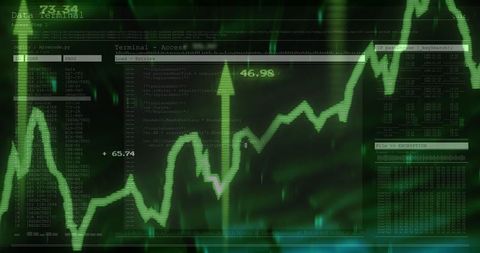
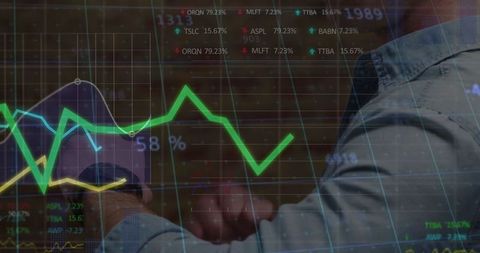
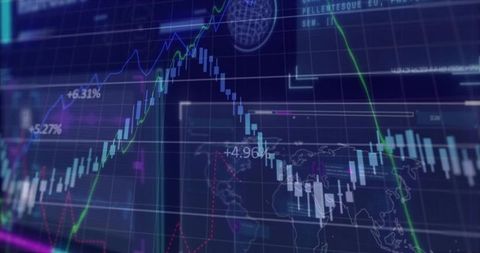
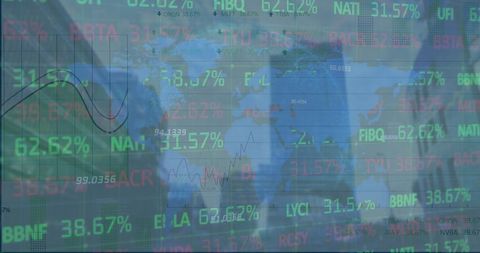
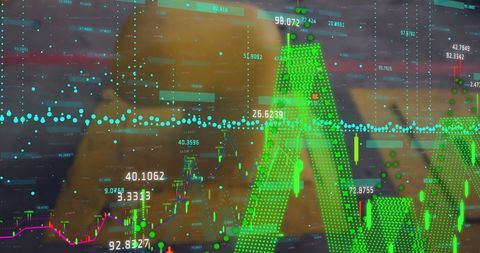
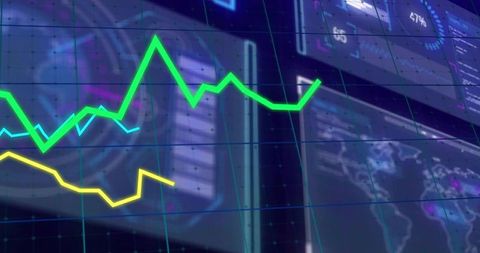
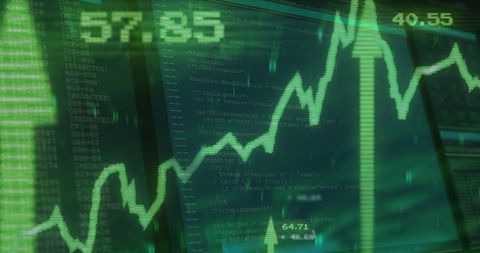
- Dynamic Financial Analysis on Digital Trading Screen
Dynamic Financial Analysis on Digital Trading Screen Image

Green lines depict fluctuations on financial trading screen with numeric labels, used for showcasing data visualization and stock market analysis. Ideal for portraying investment tools, digital analytics technology, or business presentations focused on financial strategies.

downloads
Tags:
More
Credit Photo
If you would like to credit the Photo, here are some ways you can do so
Text Link
photo Link
<span class="text-link">
<span>
<a target="_blank" href=https://pikwizard.com/photo/dynamic-financial-analysis-on-digital-trading-screen/ffdcc5340bd4098567cad8059997aefc/>PikWizard</a>
</span>
</span>
<span class="image-link">
<span
style="margin: 0 0 20px 0; display: inline-block; vertical-align: middle; width: 100%;"
>
<a
target="_blank"
href="https://pikwizard.com/photo/dynamic-financial-analysis-on-digital-trading-screen/ffdcc5340bd4098567cad8059997aefc/"
style="text-decoration: none; font-size: 10px; margin: 0;"
>
<img src="https://pikwizard.com/pw/medium/ffdcc5340bd4098567cad8059997aefc.jpg" style="margin: 0; width: 100%;" alt="" />
<p style="font-size: 12px; margin: 0;">PikWizard</p>
</a>
</span>
</span>
Free (free of charge)
Free for personal and commercial use.
Author: People Creations