
- Home >
- Stock Photos >
- Dynamic Financial Analysis with Data Graphics
Dynamic Financial Analysis with Data Graphics Image

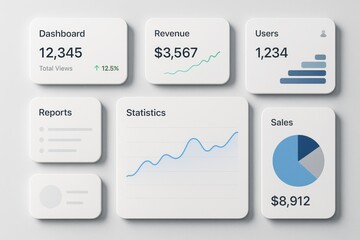
Illustration conveying a modern, digital approach to financial analysis. Using a green color palette, it includes intricate data charts and progress indicators, suggesting relevancy for global business strategy, stock trading visualization, or digital interfaces for tech-savvy finance applications.
Powered by 


downloads
Tags:
More
Credit Photo
If you would like to credit the Photo, here are some ways you can do so
Text Link
photo Link
<span class="text-link">
<span>
<a target="_blank" href=https://pikwizard.com/photo/dynamic-financial-analysis-with-data-graphics/56b3b538e5f2b69dd0e993dd39e96204/>PikWizard</a>
</span>
</span>
<span class="image-link">
<span
style="margin: 0 0 20px 0; display: inline-block; vertical-align: middle; width: 100%;"
>
<a
target="_blank"
href="https://pikwizard.com/photo/dynamic-financial-analysis-with-data-graphics/56b3b538e5f2b69dd0e993dd39e96204/"
style="text-decoration: none; font-size: 10px; margin: 0;"
>
<img src="https://pikwizard.com/pw/medium/56b3b538e5f2b69dd0e993dd39e96204.jpg" style="margin: 0; width: 100%;" alt="" />
<p style="font-size: 12px; margin: 0;">PikWizard</p>
</a>
</span>
</span>
Free (free of charge)
Free for personal and commercial use.
Author: Creative Art
Similar Free Stock Images

Premium


Premium

Premium


Premium


Premium

Premium
Premium

Premium


Premium


Premium


Premium


Premium


Premium

Premium


Premium


Premium


Premium


Premium


Premium


Premium


Premium


Premium


Premium

Premium


Premium


Explore More Free Stock Images