- Home >
- Stock Photos >
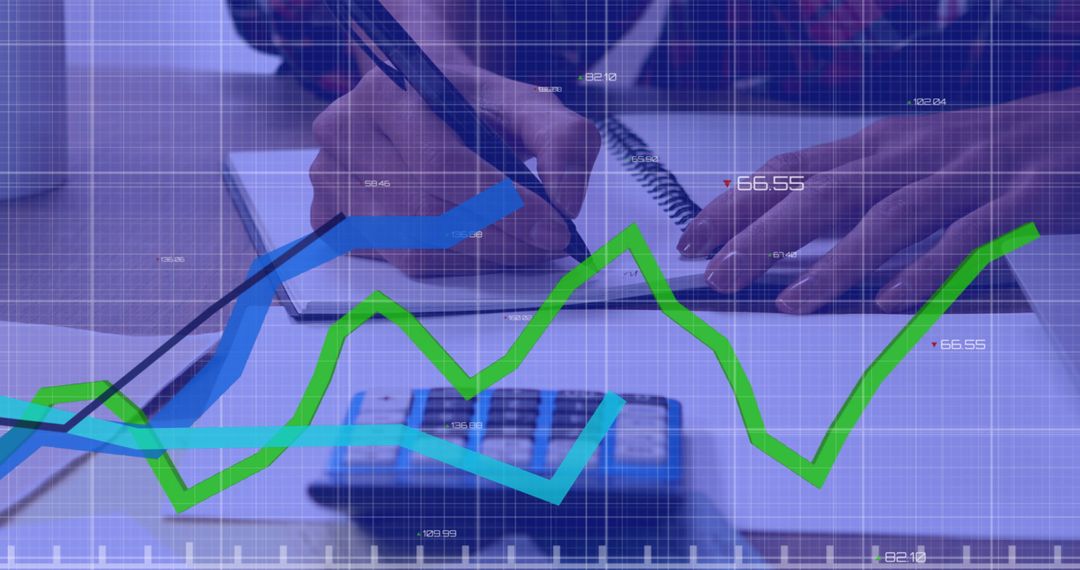
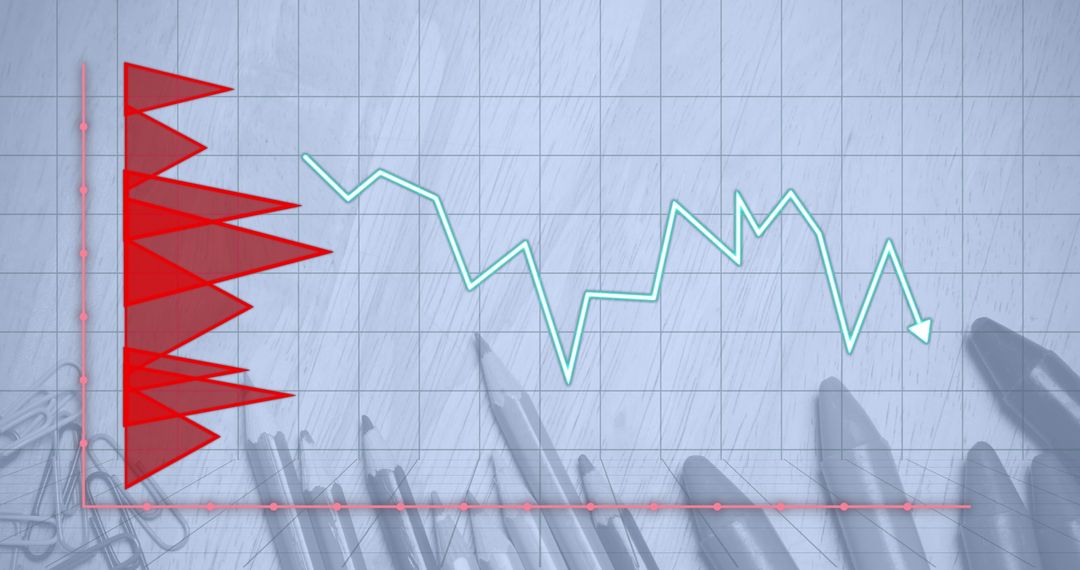
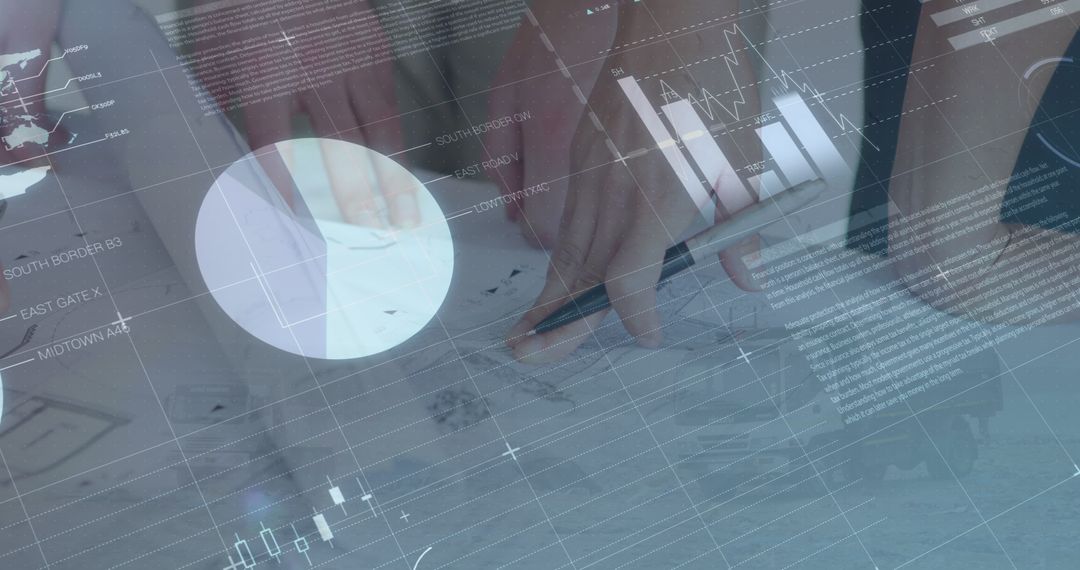
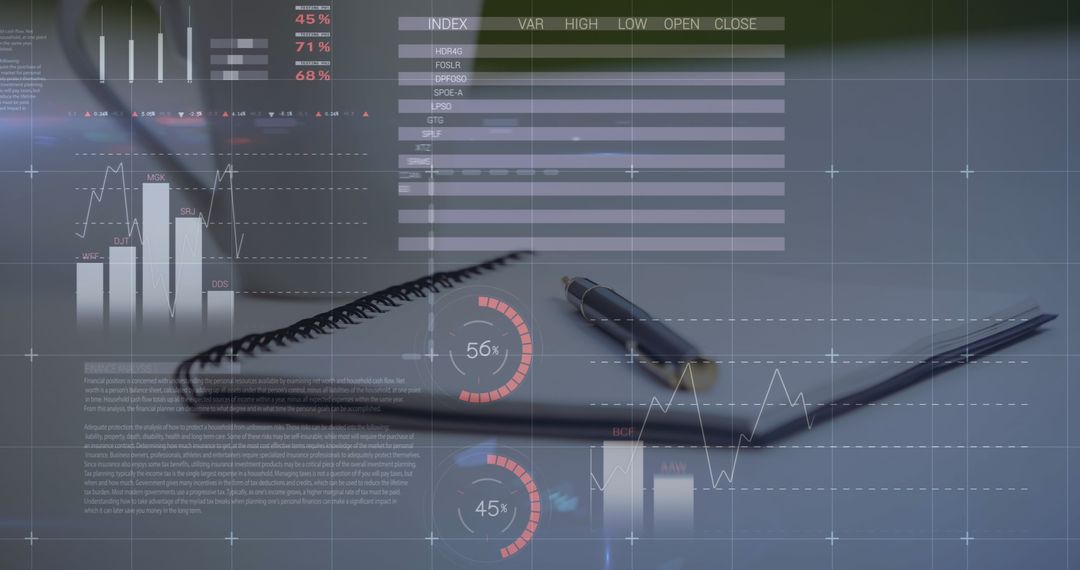
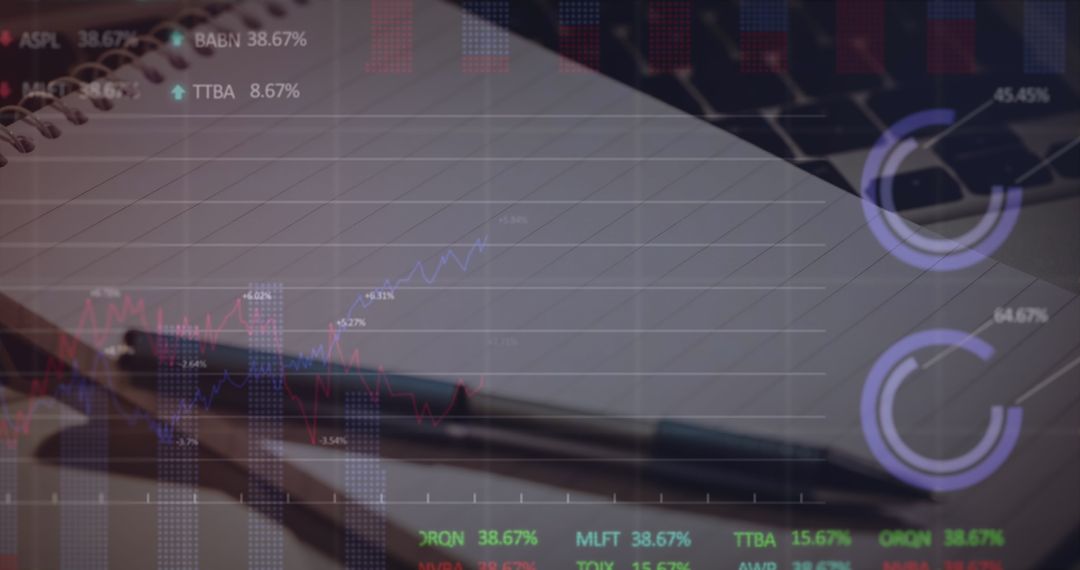
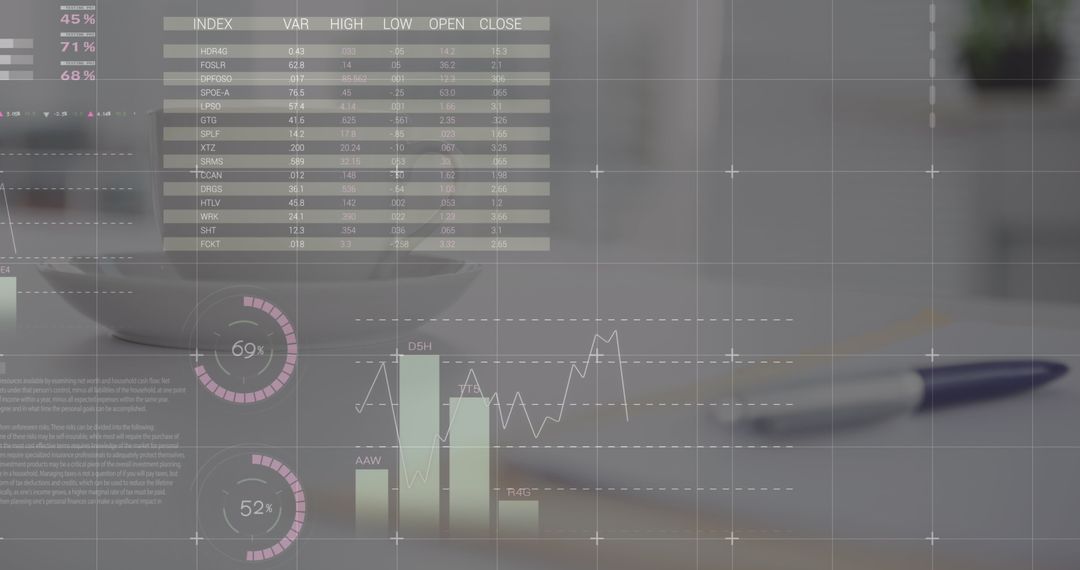
- Dynamic Financial Analysis with Digital Graphs and Fountain Pen
Dynamic Financial Analysis with Digital Graphs and Fountain Pen Image

This image the intersect of traditional finance tools and modern digital analytics, symbolizing innovation in business information technology. The pen suggests decision-making as the line graph projects dynamic financial analytics trends. Ideal for digital transformation presentations, finance software marketing, business improvement blogs, and analytical reports targeting key stakeholders embracing modern insights.
Powered by 


0
downloads
downloads
Tags:
More
Credit Photo
If you would like to credit the Photo, here are some ways you can do so
Text Link
photo Link
<span class="text-link">
<span>
<a target="_blank" href=https://pikwizard.com/photo/dynamic-financial-analysis-with-digital-graphs-and-fountain-pen/2143c21542994a15484db75bf93804e7/>PikWizard</a>
</span>
</span>
<span class="image-link">
<span
style="margin: 0 0 20px 0; display: inline-block; vertical-align: middle; width: 100%;"
>
<a
target="_blank"
href="https://pikwizard.com/photo/dynamic-financial-analysis-with-digital-graphs-and-fountain-pen/2143c21542994a15484db75bf93804e7/"
style="text-decoration: none; font-size: 10px; margin: 0;"
>
<img src="https://pikwizard.com/pw/medium/2143c21542994a15484db75bf93804e7.jpg" style="margin: 0; width: 100%;" alt="" />
<p style="font-size: 12px; margin: 0;">PikWizard</p>
</a>
</span>
</span>
Free (free of charge)
Free for personal and commercial use.
Author: Authentic Images
Similar Free Stock Images

Premium


Premium


Premium


Premium


Premium


Premium


Premium


Premium


Premium


Premium


Premium


Premium


Premium


Premium


Premium


Premium


Premium


Premium


Premium


Premium


Premium


Premium


Premium


Premium