- Home >
- Stock Photos >
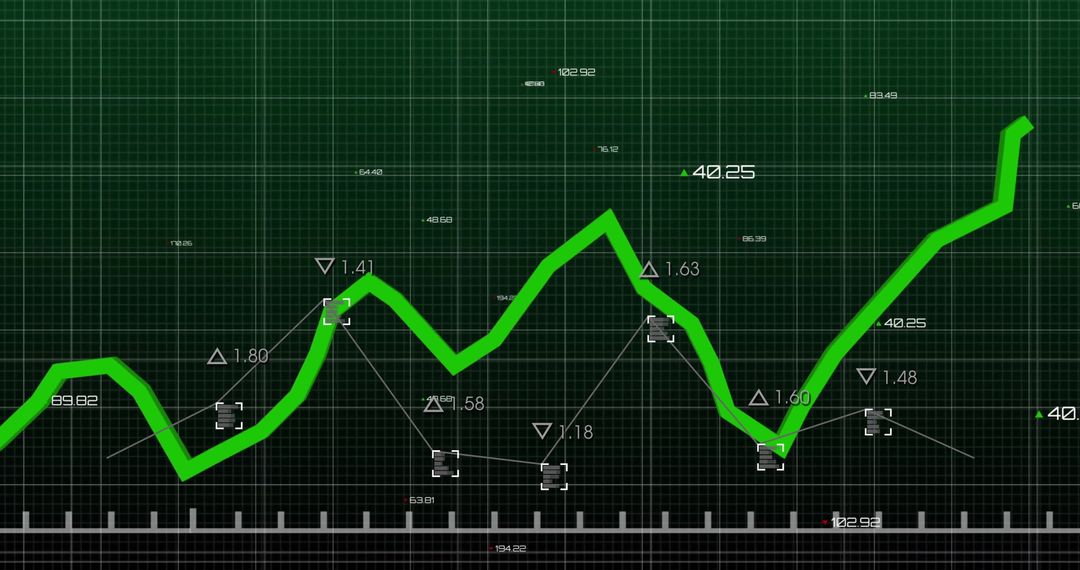
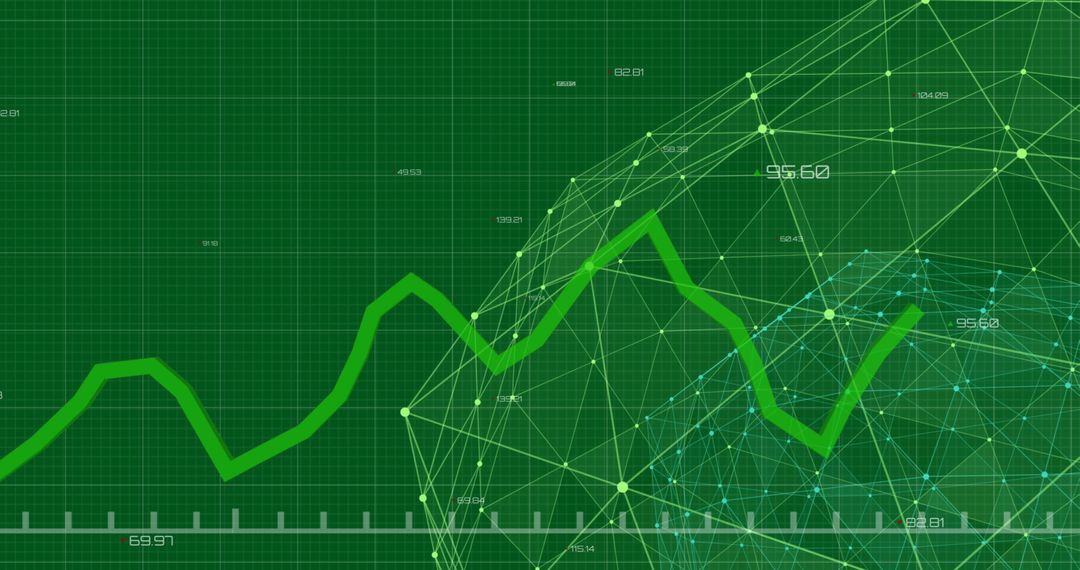
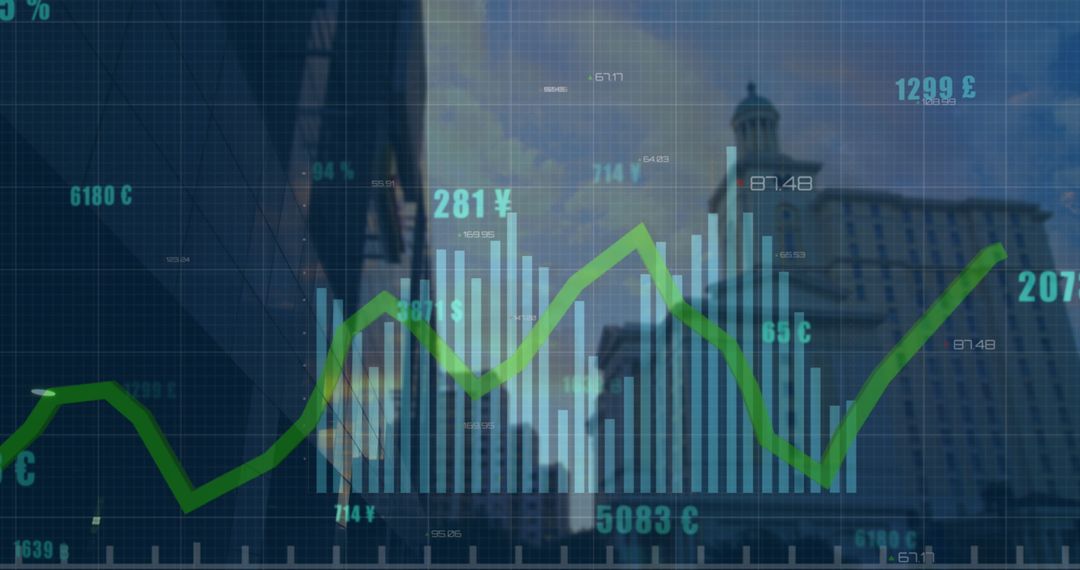
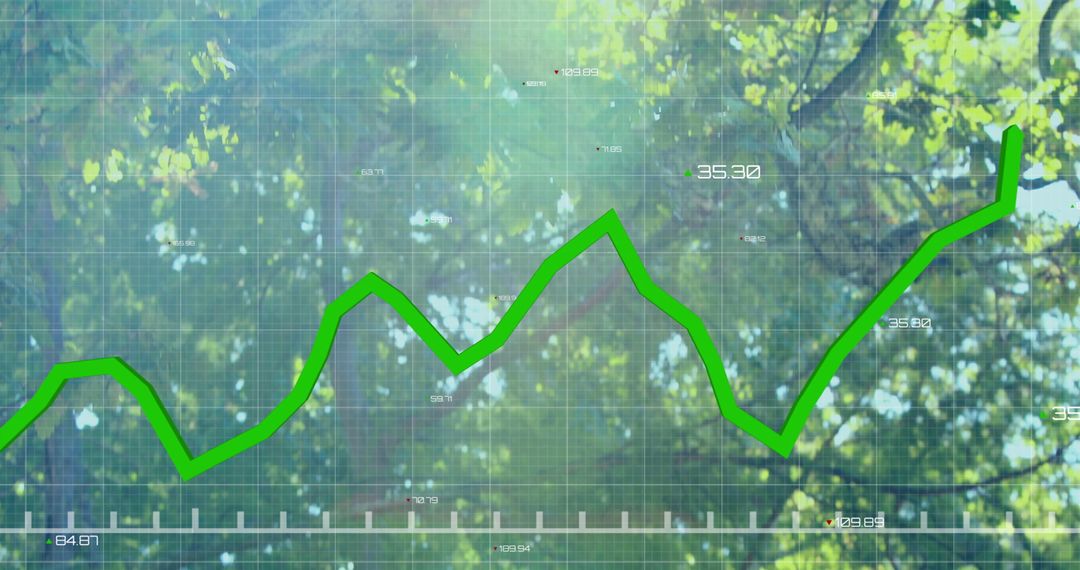
- Dynamic Financial Analysis with Green Trend Line on Grid
Dynamic Financial Analysis with Green Trend Line on Grid Image
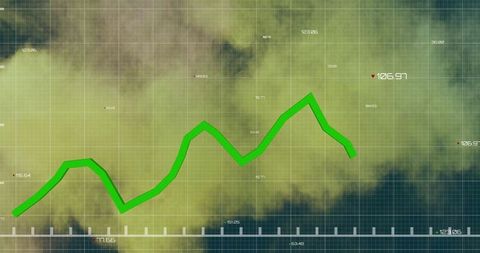
Green trend line on white grid depicts financial growth pattern with numeric labels for precise analysis. Red downward arrow indicates potential data fluctuations. Useful for presentations in business, finance, or academic settings focusing on market trends, financial forecasting, and data-centric decision-making.
Powered by 


0
downloads
downloads
Tags:
More
Credit Photo
If you would like to credit the Photo, here are some ways you can do so
Text Link
photo Link
<span class="text-link">
<span>
<a target="_blank" href=https://pikwizard.com/photo/dynamic-financial-analysis-with-green-trend-line-on-grid/c783e363c6c30535e7f407fdd5aedbb1/>PikWizard</a>
</span>
</span>
<span class="image-link">
<span
style="margin: 0 0 20px 0; display: inline-block; vertical-align: middle; width: 100%;"
>
<a
target="_blank"
href="https://pikwizard.com/photo/dynamic-financial-analysis-with-green-trend-line-on-grid/c783e363c6c30535e7f407fdd5aedbb1/"
style="text-decoration: none; font-size: 10px; margin: 0;"
>
<img src="https://pikwizard.com/pw/medium/c783e363c6c30535e7f407fdd5aedbb1.jpg" style="margin: 0; width: 100%;" alt="" />
<p style="font-size: 12px; margin: 0;">PikWizard</p>
</a>
</span>
</span>
Free (free of charge)
Free for personal and commercial use.
Author: Awesome Content
Similar Free Stock Images

Premium


Premium


Premium


Premium


Premium


Premium


Premium


Premium


Premium


Premium


Premium


Premium


Premium


Premium


Premium


Premium


Premium


Premium


Premium


Premium


Premium


Premium


Premium


Premium