- Home >
- Stock Photos >
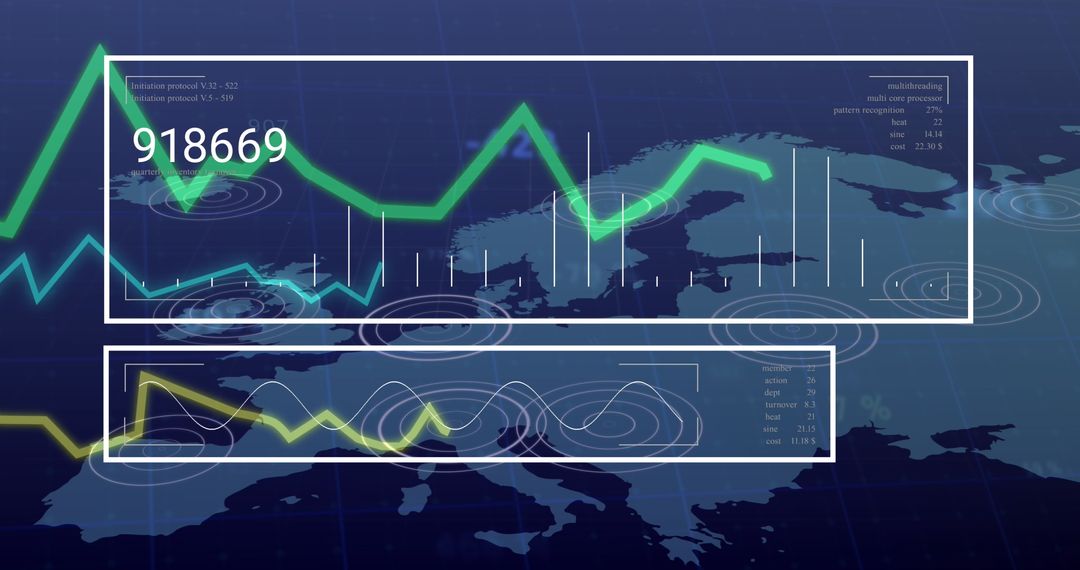
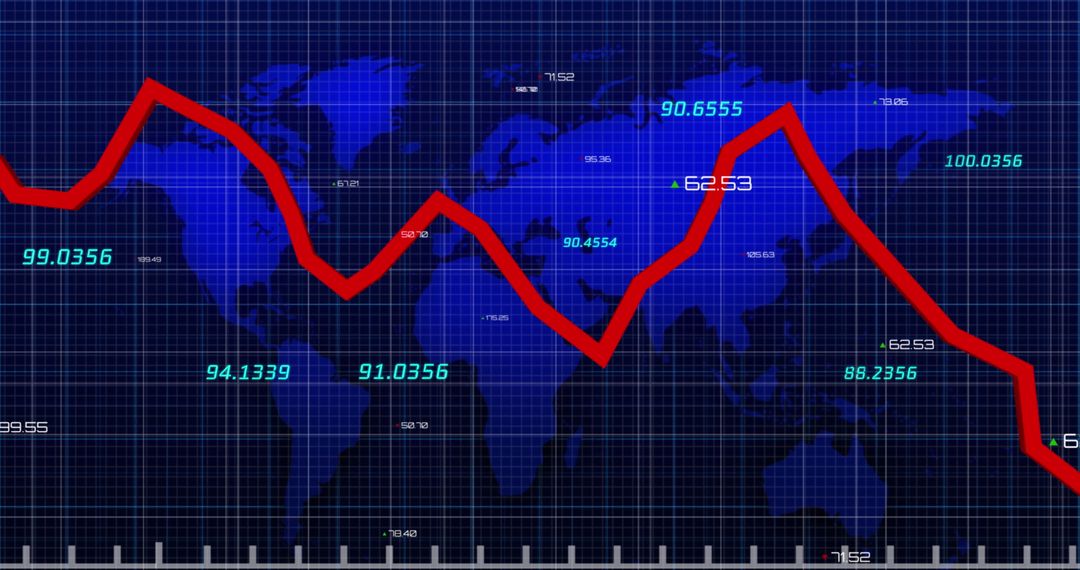
- Dynamic Financial Analysis with World Map and Diverse Graphs
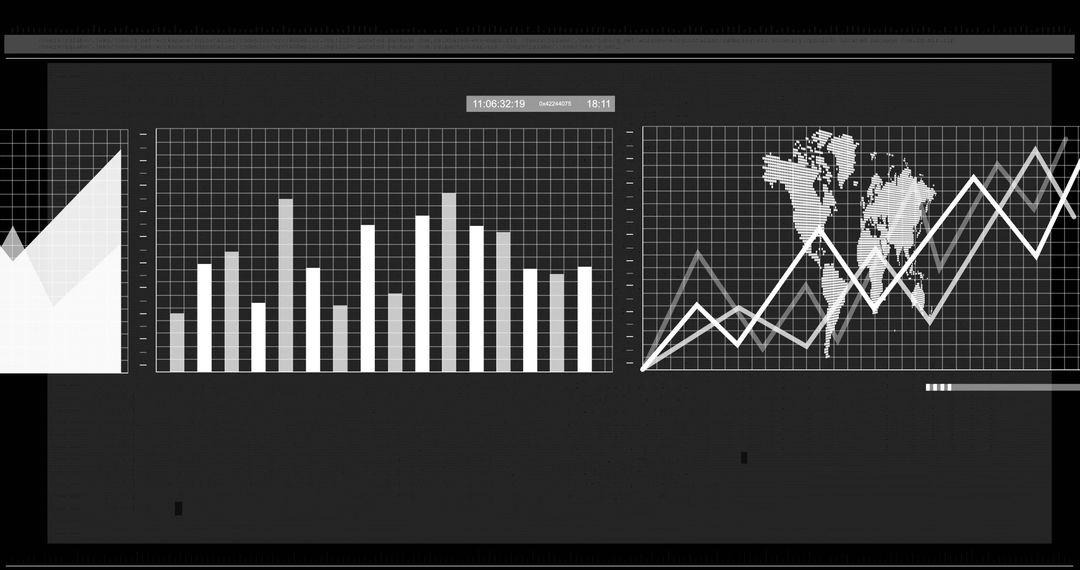
Dynamic Financial Analysis with World Map and Diverse Graphs Image

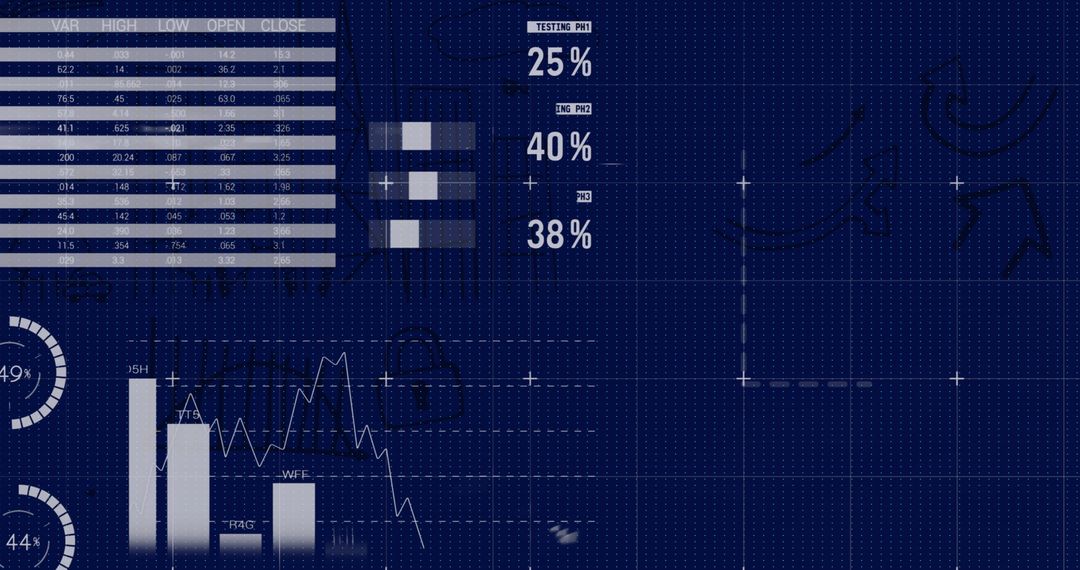
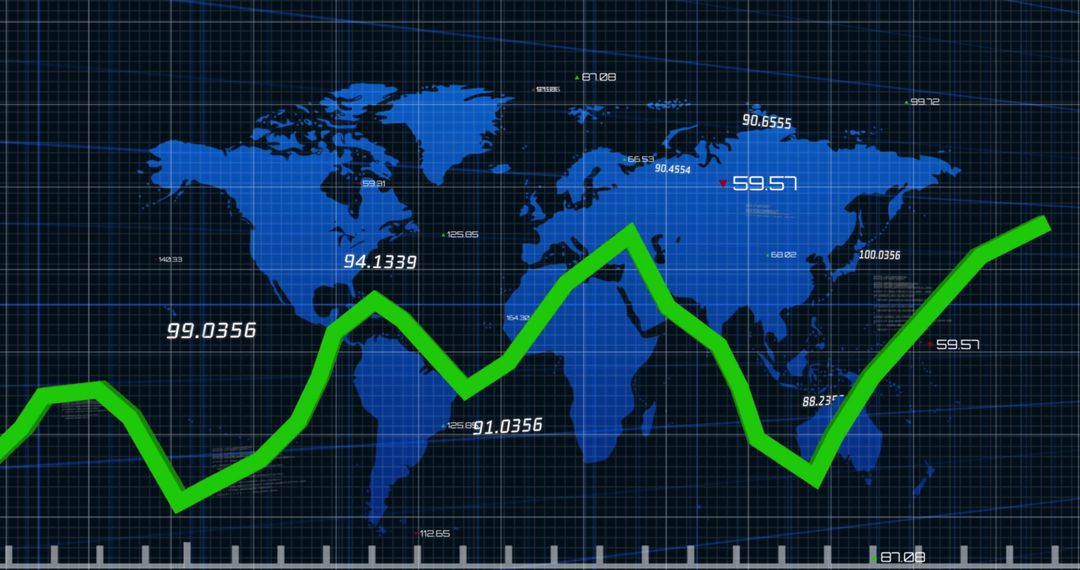
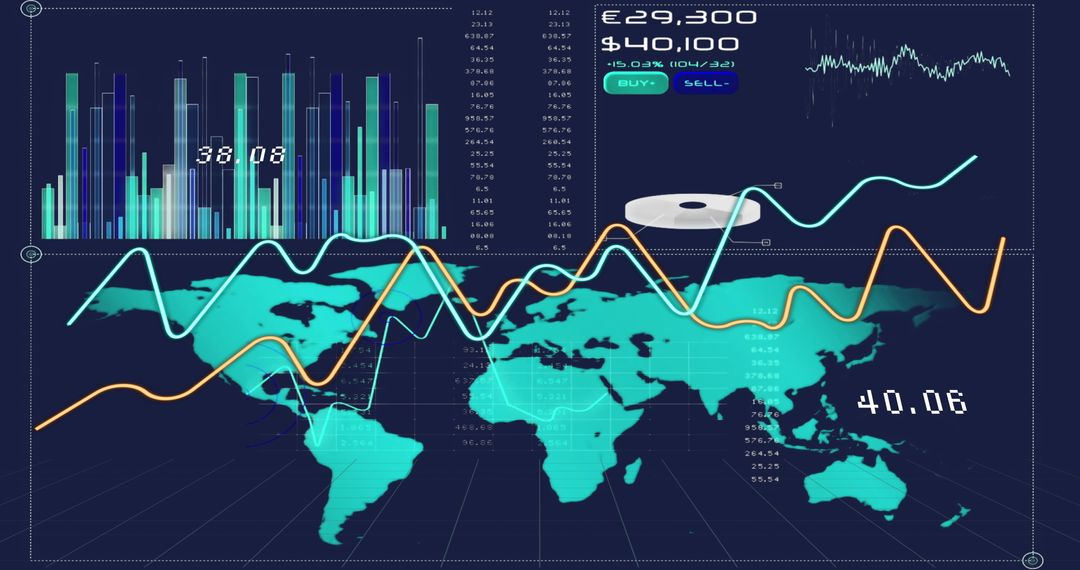
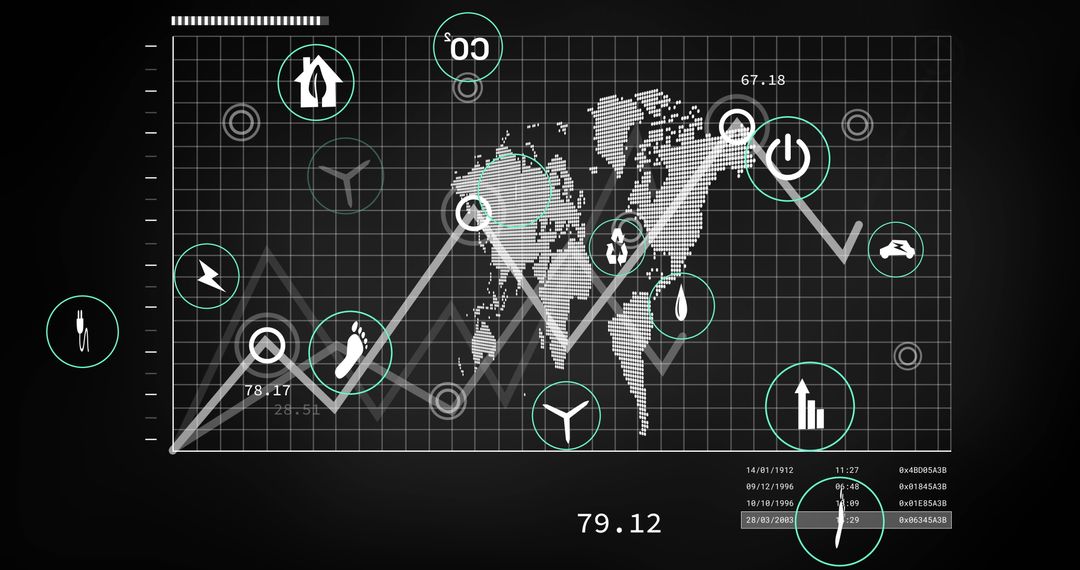
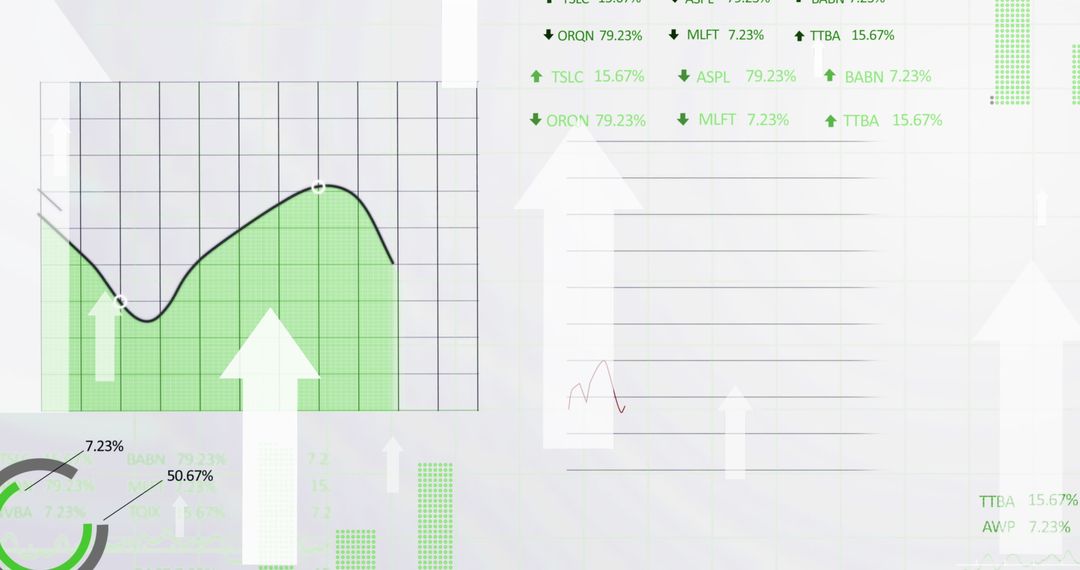
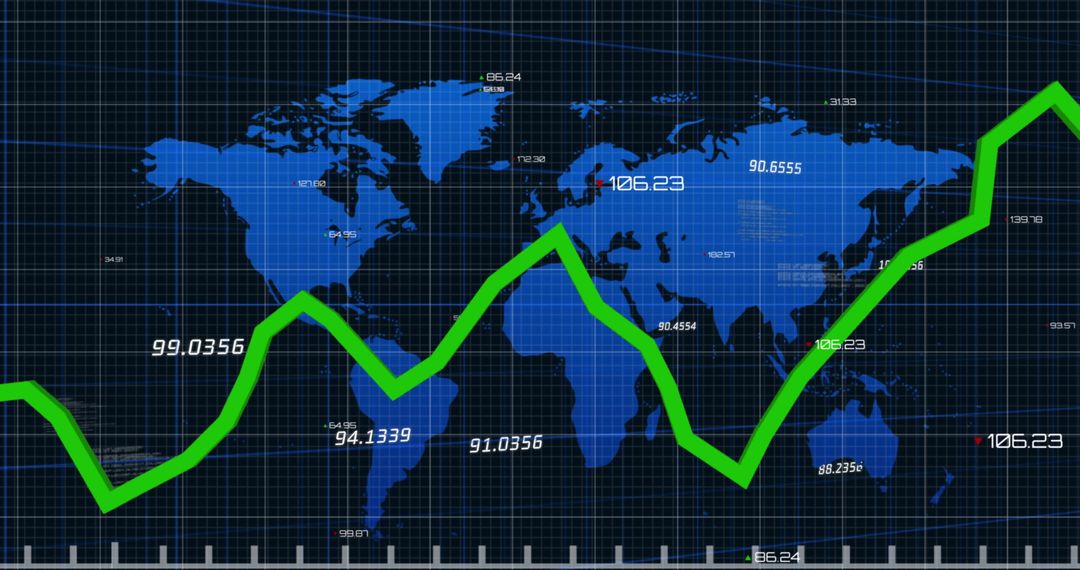
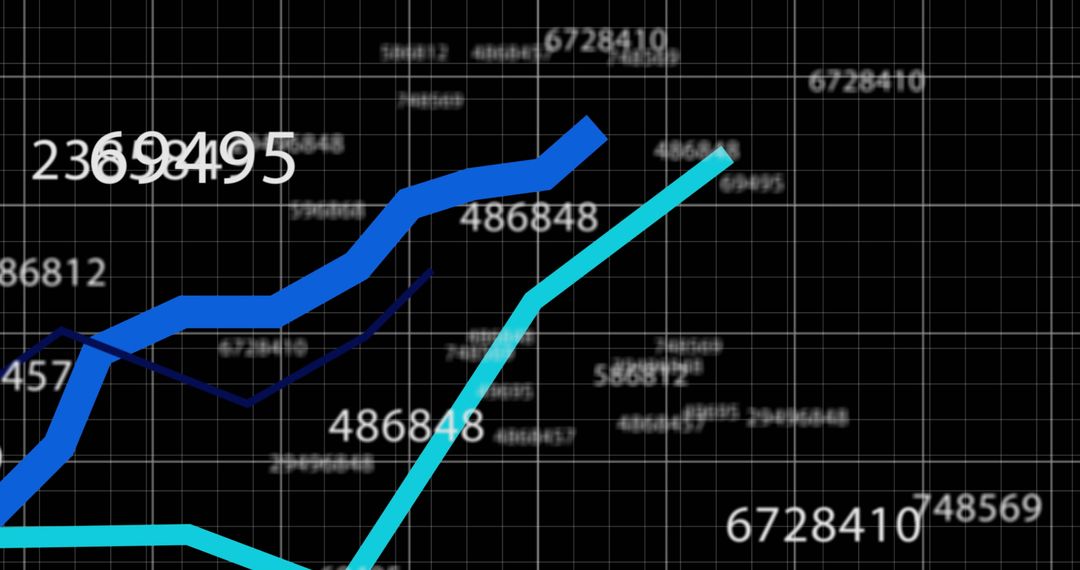
Image illustrates dynamic economic trends with a combination of global map background accompanied by diverse line and bar graphs in blue and white tones, suited for presentations, financial reports, or articles on global economy analysis. Visually conveys analytics, market trends, and monetary discussions in digital contexts.
Powered by  - Get 15% off with code: PIKWIZARD15


2
downloads
downloads
Tags:
More
Credit Photo
If you would like to credit the Photo, here are some ways you can do so
Text Link
photo Link
<span class="text-link">
<span>
<a target="_blank" href=https://pikwizard.com/photo/dynamic-financial-analysis-with-world-map-and-diverse-graphs/cdce72cccc7f79963567b5f6fcbec111/>PikWizard</a>
</span>
</span>
<span class="image-link">
<span
style="margin: 0 0 20px 0; display: inline-block; vertical-align: middle; width: 100%;"
>
<a
target="_blank"
href="https://pikwizard.com/photo/dynamic-financial-analysis-with-world-map-and-diverse-graphs/cdce72cccc7f79963567b5f6fcbec111/"
style="text-decoration: none; font-size: 10px; margin: 0;"
>
<img src="https://pikwizard.com/pw/medium/cdce72cccc7f79963567b5f6fcbec111.jpg" style="margin: 0; width: 100%;" alt="" />
<p style="font-size: 12px; margin: 0;">PikWizard</p>
</a>
</span>
</span>
Free (free of charge)
Free for personal and commercial use.
Author: Creative Art
Similar Free Stock Images

Premium


Premium


Premium


Premium


Premium


Premium


Premium


Premium


Premium


Premium


Premium


Premium


Premium


Premium


Premium


Premium


Premium


Premium


Premium


Premium


Premium


Premium


Premium


Premium