- Home >
- Stock Photos >
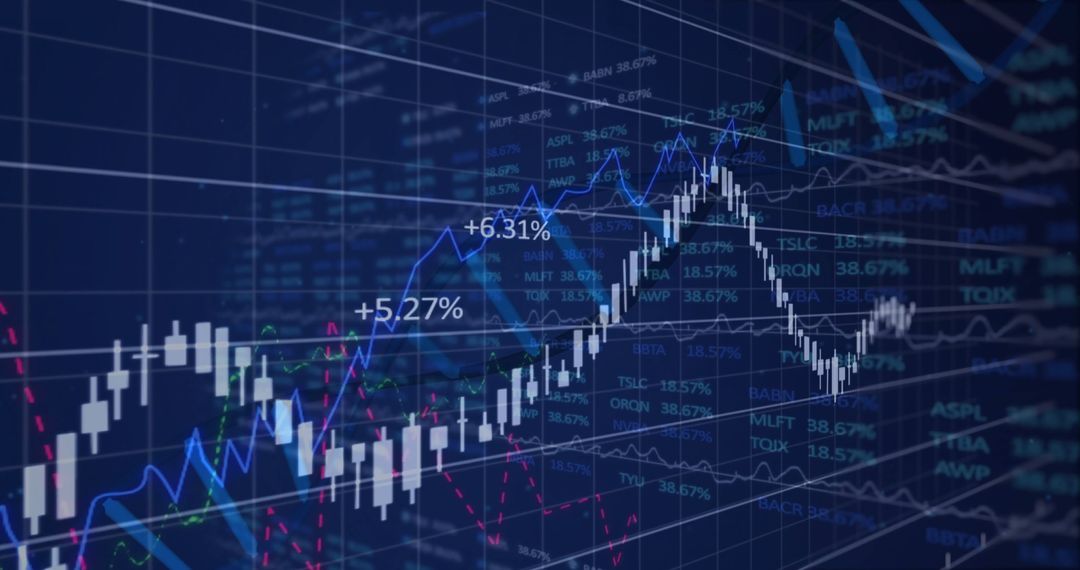
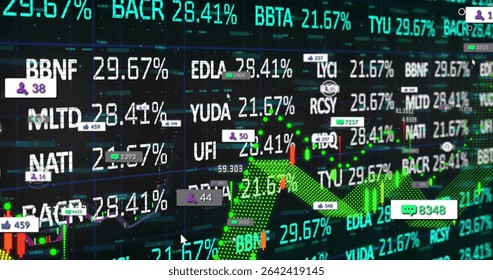
- Dynamic Financial Analytic Dashboard with Stock Candlestick Charts
Dynamic Financial Analytic Dashboard with Stock Candlestick Charts Image

This depiction of a sophisticated digital trading terminal exhibits candlestick charts and stock names, providing insight into stock market dynamics. Ideal for use in financial analytic presentations, investment portals, trading applications, or educational materials on financial markets.
Powered by  - Get 15% off with code: PIKWIZARD15


0
downloads
downloads
Tags:
More
Credit Photo
If you would like to credit the Photo, here are some ways you can do so
Text Link
photo Link
<span class="text-link">
<span>
<a target="_blank" href=https://pikwizard.com/photo/dynamic-financial-analytic-dashboard-with-stock-candlestick-charts/f197e013072df8fe1ddafd9bc3359aba/>PikWizard</a>
</span>
</span>
<span class="image-link">
<span
style="margin: 0 0 20px 0; display: inline-block; vertical-align: middle; width: 100%;"
>
<a
target="_blank"
href="https://pikwizard.com/photo/dynamic-financial-analytic-dashboard-with-stock-candlestick-charts/f197e013072df8fe1ddafd9bc3359aba/"
style="text-decoration: none; font-size: 10px; margin: 0;"
>
<img src="https://pikwizard.com/pw/medium/f197e013072df8fe1ddafd9bc3359aba.jpg" style="margin: 0; width: 100%;" alt="" />
<p style="font-size: 12px; margin: 0;">PikWizard</p>
</a>
</span>
</span>
Free (free of charge)
Free for personal and commercial use.
Author: Authentic Images
Similar Free Stock Images

Premium


Premium


Premium


Premium


Premium


Premium


Premium


Premium


Premium


Premium


Premium


Premium


Premium


Premium


Premium


Premium


Premium


Premium


Premium


Premium


Premium


Premium


Premium


Premium