
- Home >
- Stock Photos >
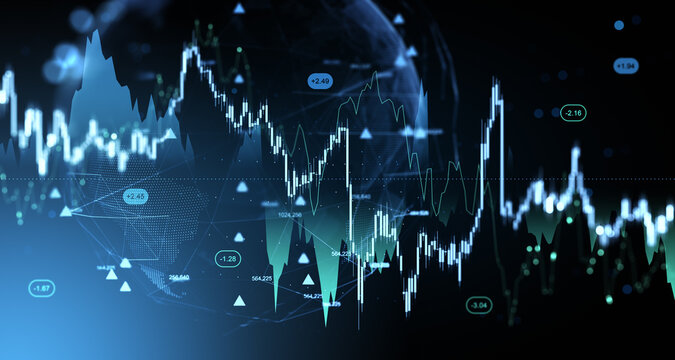
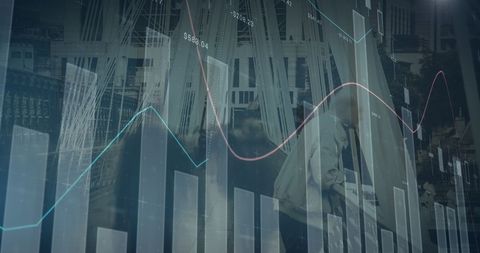
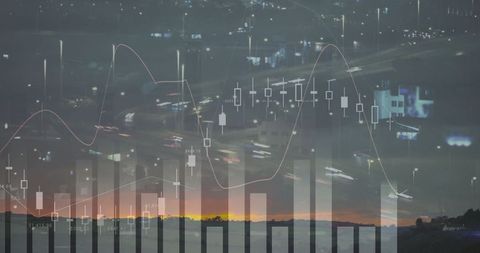
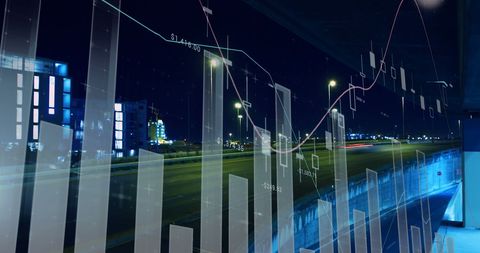
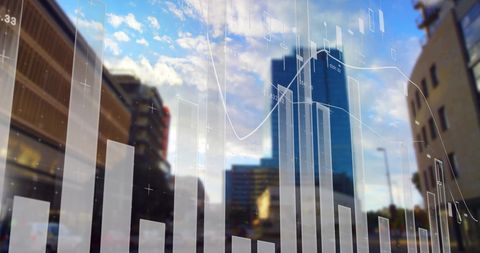
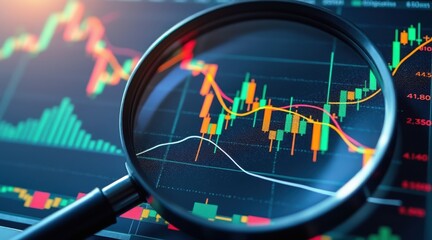
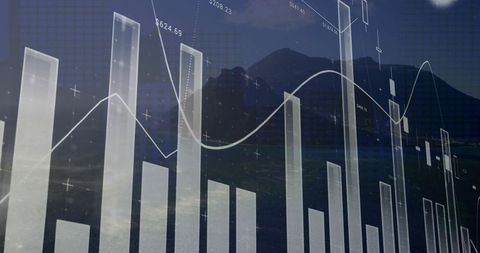
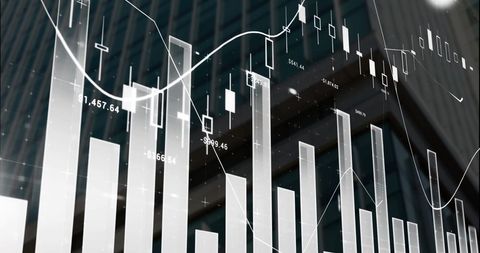
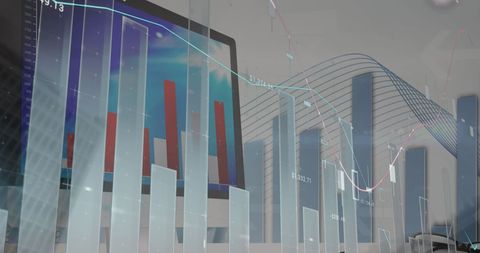
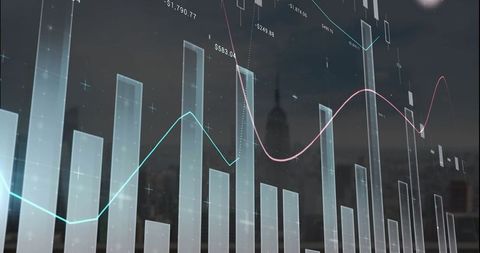
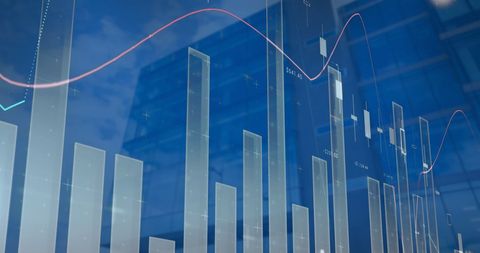
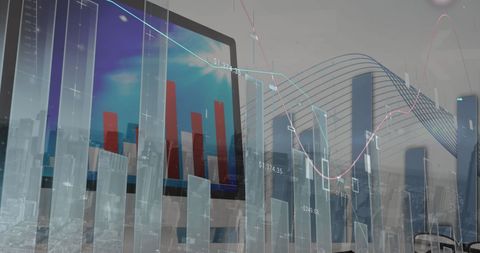
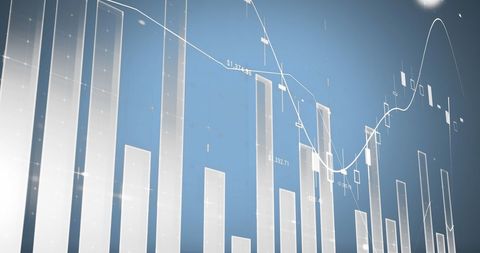
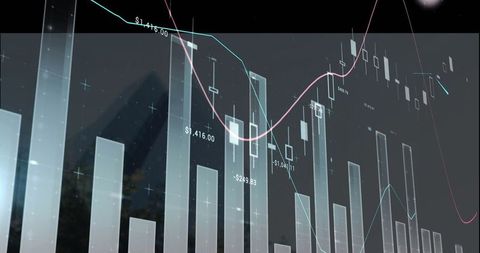
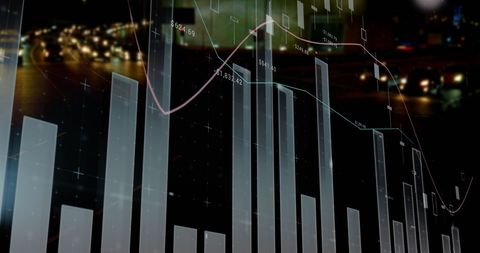
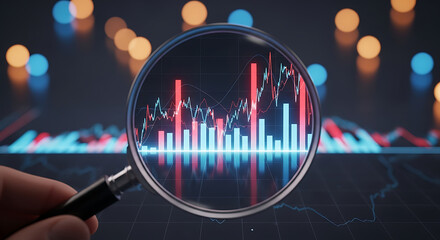
- Dynamic Financial Analytics Dashboard with Candlestick Chart
Dynamic Financial Analytics Dashboard with Candlestick Chart Image

Illustration of a modern financial dashboard featuring candlestick charts and trend lines. Ideal for use in financial presentations, business reports, or as a background in financial news articles. It showcases technology-oriented design with emphasis on economic data and market analysis.
Powered by 


downloads
Tags:
More
Credit Photo
If you would like to credit the Photo, here are some ways you can do so
Text Link
photo Link
<span class="text-link">
<span>
<a target="_blank" href=https://pikwizard.com/photo/dynamic-financial-analytics-dashboard-with-candlestick-chart/973524737910eff6ead3dd299d24d5df/>PikWizard</a>
</span>
</span>
<span class="image-link">
<span
style="margin: 0 0 20px 0; display: inline-block; vertical-align: middle; width: 100%;"
>
<a
target="_blank"
href="https://pikwizard.com/photo/dynamic-financial-analytics-dashboard-with-candlestick-chart/973524737910eff6ead3dd299d24d5df/"
style="text-decoration: none; font-size: 10px; margin: 0;"
>
<img src="https://pikwizard.com/pw/medium/973524737910eff6ead3dd299d24d5df.jpg" style="margin: 0; width: 100%;" alt="" />
<p style="font-size: 12px; margin: 0;">PikWizard</p>
</a>
</span>
</span>
Free (free of charge)
Free for personal and commercial use.
Author: People Creations
Similar Free Stock Images
Premium


Premium


Premium


Premium


Premium


Premium

Premium

Premium


Premium

Premium


Premium


Premium


Premium


Premium


Premium


Premium


Premium

Premium


Premium


Premium


Premium


Premium


Premium


Premium


Premium

Explore More Free Stock Images