
- Home >
- Stock Photos >
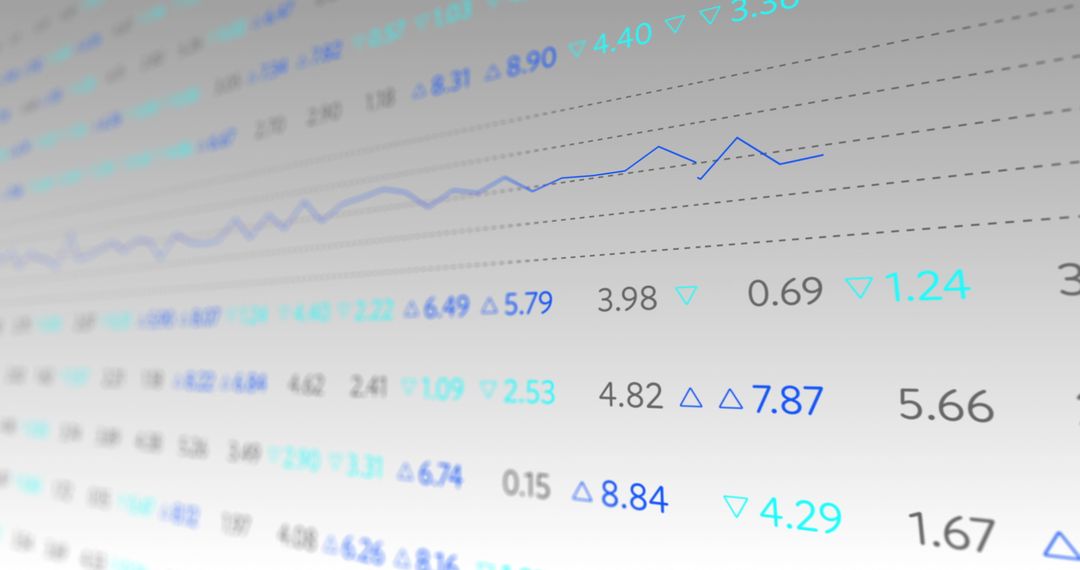
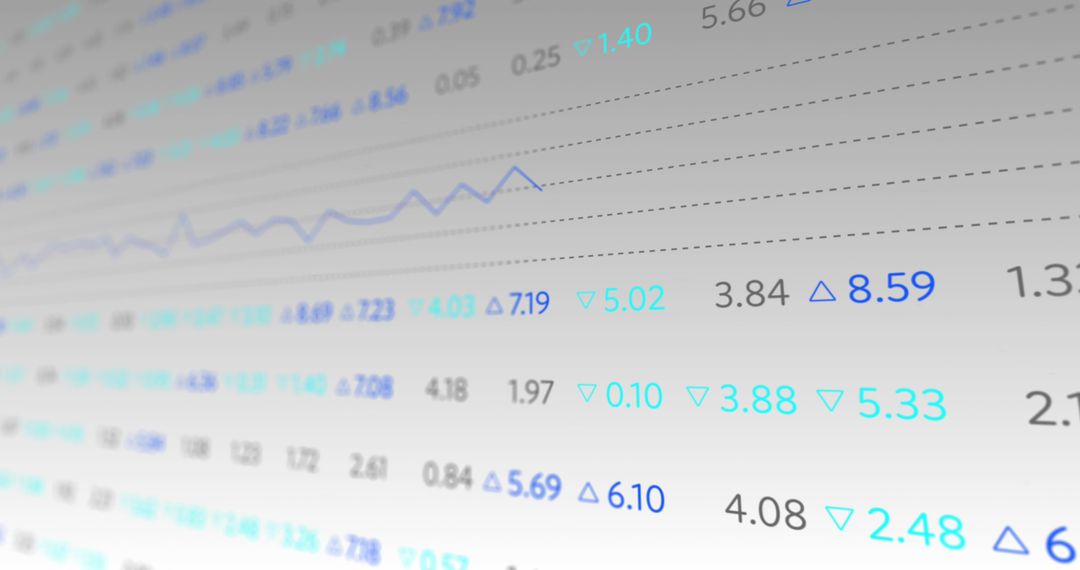
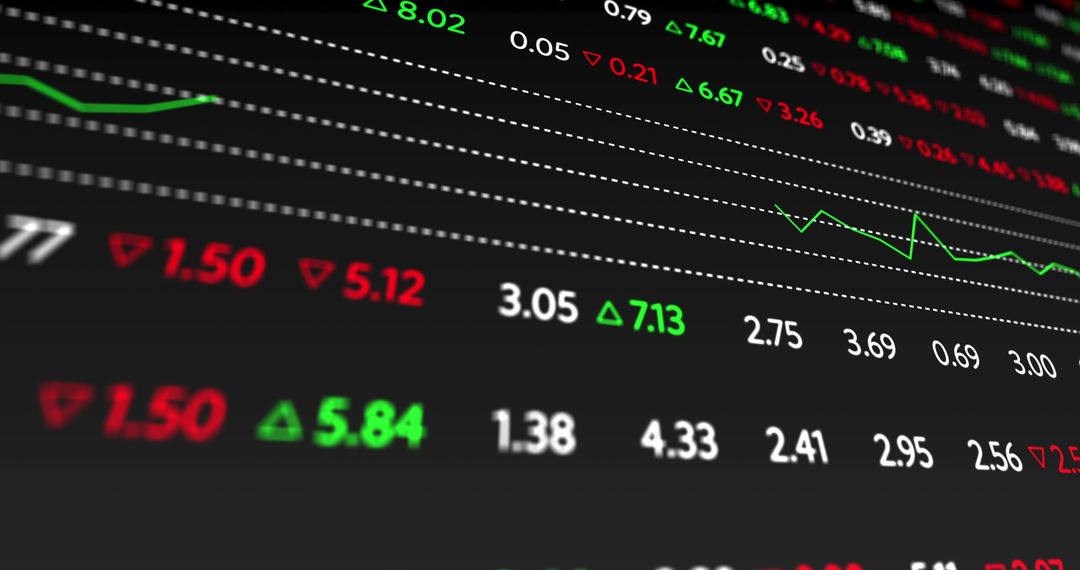
- Dynamic Financial and Healthcare Data Visual Analysis
Dynamic Financial and Healthcare Data Visual Analysis Image

Ideal for illustrating concepts in economic forecasting, healthcare statistics, or stock market trends, especially during a global pandemic. Useful in presentations or articles about digital data revolution, financial impacts of medical crises, and contemporary business challenges.
Powered by 


2
downloads
downloads
Tags:
More
Credit Photo
If you would like to credit the Photo, here are some ways you can do so
Text Link
photo Link
<span class="text-link">
<span>
<a target="_blank" href=https://pikwizard.com/photo/dynamic-financial-and-healthcare-data-visual-analysis/3c34ca2820a67cdab0a913f8e6e4c74d/>PikWizard</a>
</span>
</span>
<span class="image-link">
<span
style="margin: 0 0 20px 0; display: inline-block; vertical-align: middle; width: 100%;"
>
<a
target="_blank"
href="https://pikwizard.com/photo/dynamic-financial-and-healthcare-data-visual-analysis/3c34ca2820a67cdab0a913f8e6e4c74d/"
style="text-decoration: none; font-size: 10px; margin: 0;"
>
<img src="https://pikwizard.com/pw/medium/3c34ca2820a67cdab0a913f8e6e4c74d.jpg" style="margin: 0; width: 100%;" alt="" />
<p style="font-size: 12px; margin: 0;">PikWizard</p>
</a>
</span>
</span>
Free (free of charge)
Free for personal and commercial use.
Author: Authentic Images
Similar Free Stock Images
Premium


Premium


Premium


Premium


Premium


Premium


Premium


Premium


Premium


Premium


Premium


Premium


Premium


Premium


Premium


Premium


Premium


Premium


Premium


Premium


Premium


Premium


Premium


Premium

