- Home >
- Stock Photos >
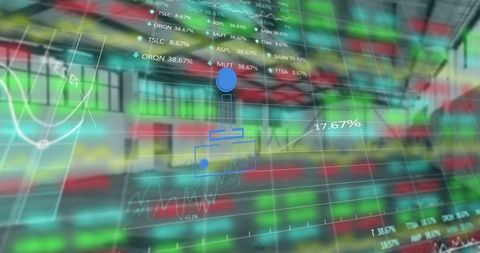
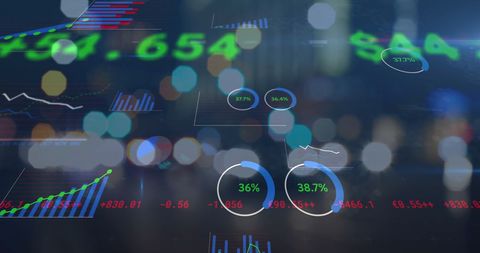
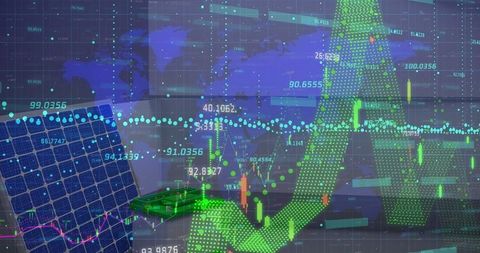
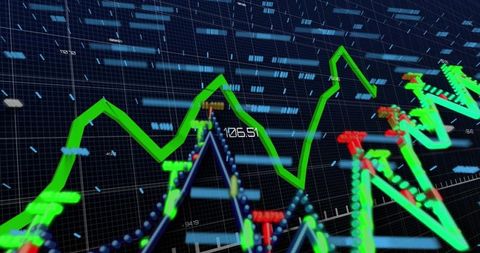
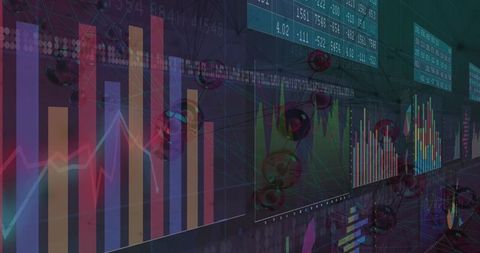
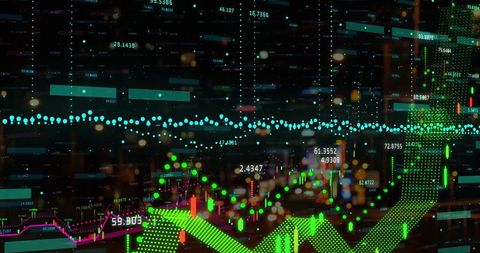
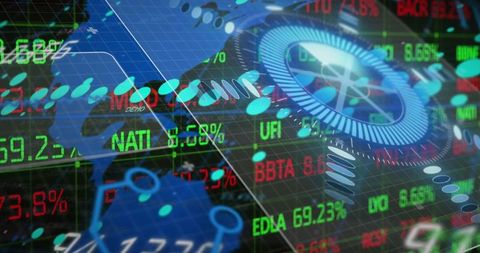
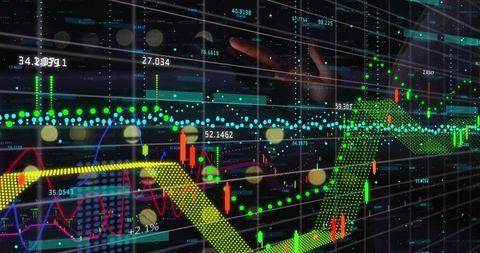
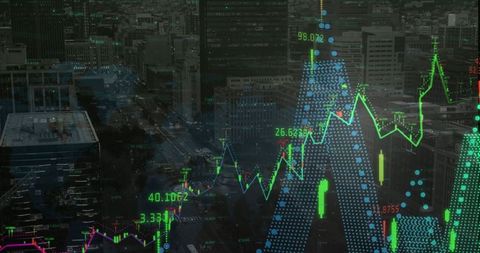
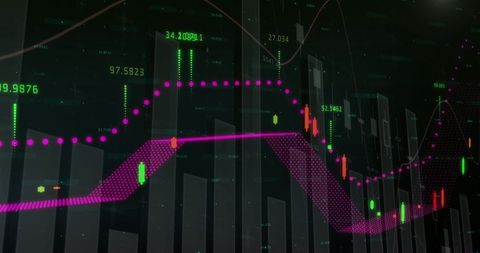
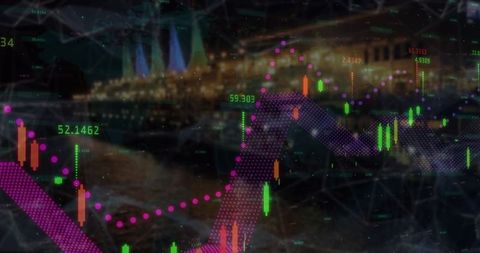
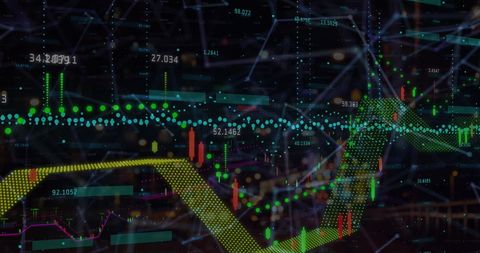
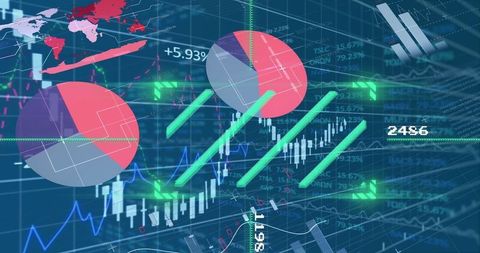
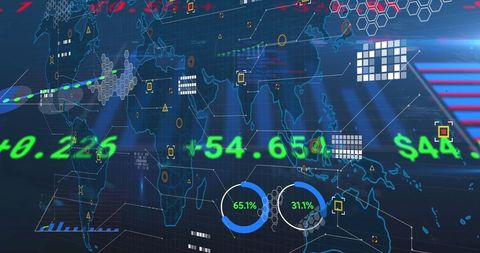
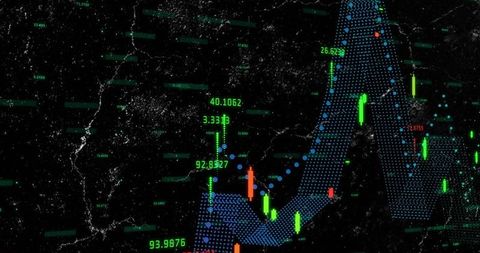
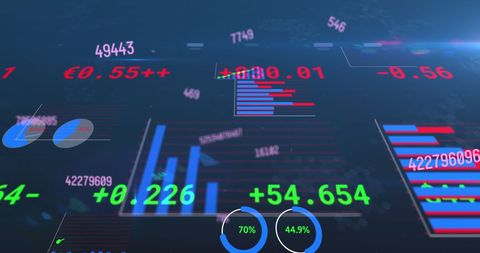
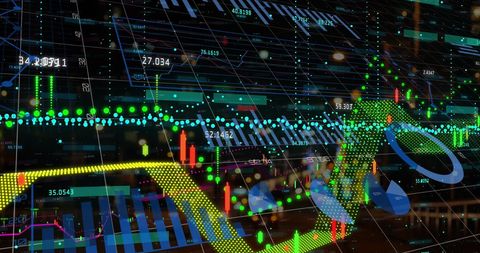
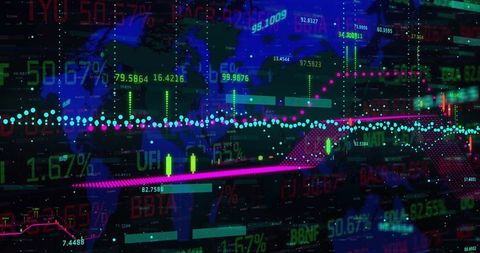
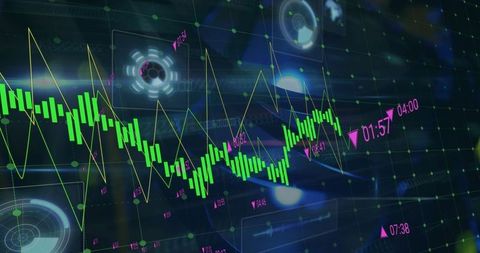
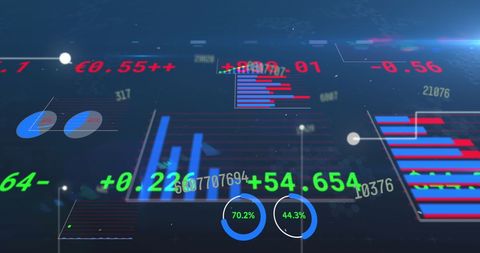
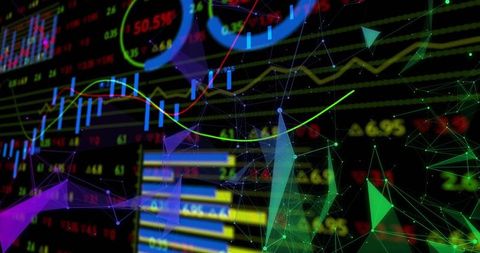
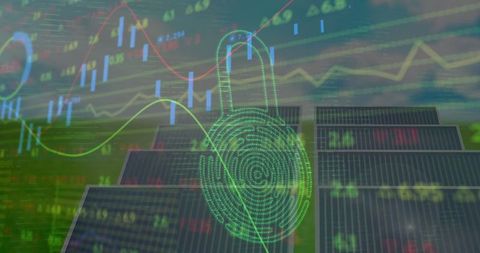
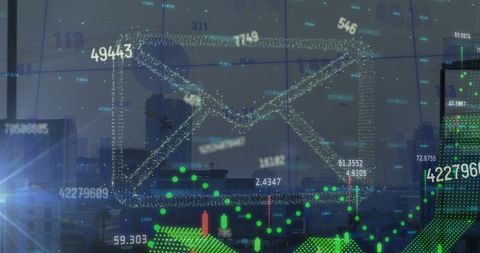
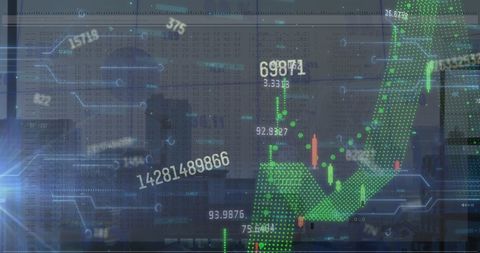
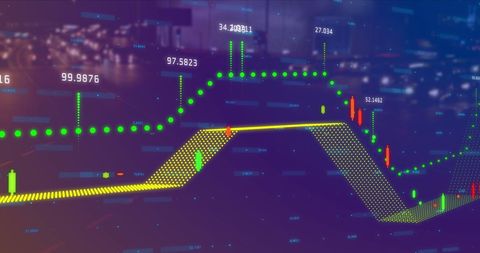
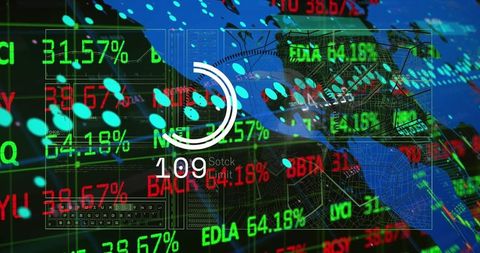
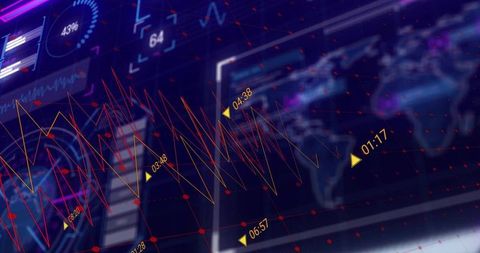
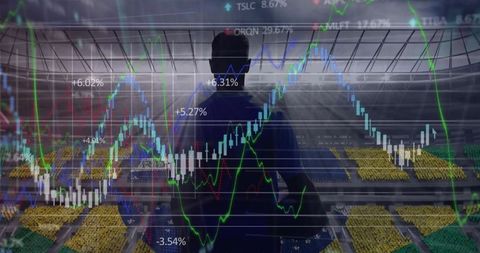
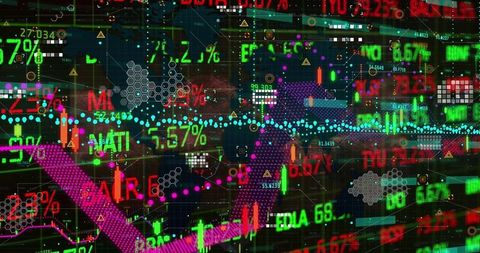
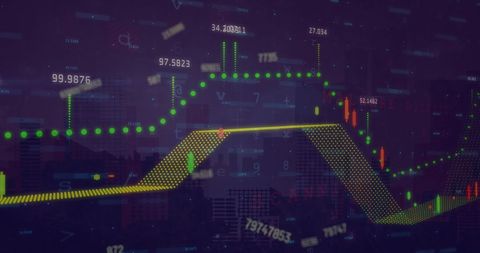
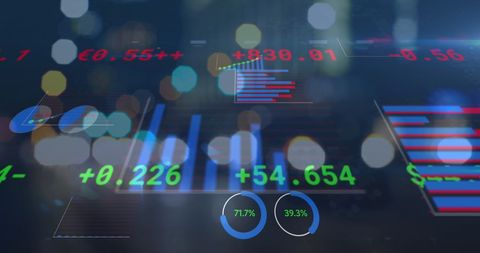
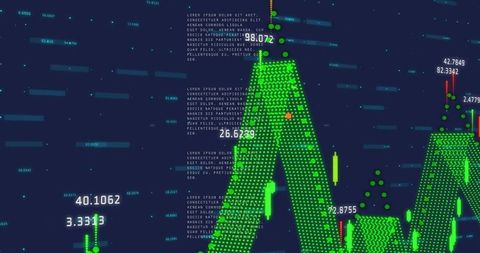
- Dynamic Financial Candlestick Chart with Data Visualization
Dynamic Financial Candlestick Chart with Data Visualization Image
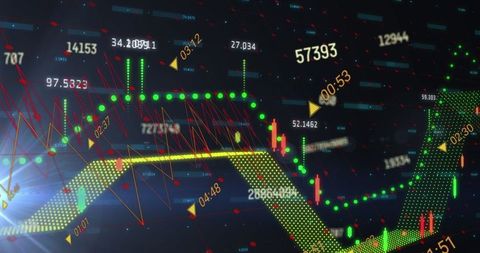
Depiction of a digital candlestick chart displaying stock and market trends, using vibrant trend lines, red markers, and numeric data on a dashboard. Useful for presentations and content relating to finance, investments, or data sciences, emphasizing complex market analytics and technological advancements.

downloads
Tags:
More
Credit Photo
If you would like to credit the Photo, here are some ways you can do so
Text Link
photo Link
<span class="text-link">
<span>
<a target="_blank" href=https://pikwizard.com/photo/dynamic-financial-candlestick-chart-with-data-visualization/f6d107334caf30b5bcec7c42cddcd326/>PikWizard</a>
</span>
</span>
<span class="image-link">
<span
style="margin: 0 0 20px 0; display: inline-block; vertical-align: middle; width: 100%;"
>
<a
target="_blank"
href="https://pikwizard.com/photo/dynamic-financial-candlestick-chart-with-data-visualization/f6d107334caf30b5bcec7c42cddcd326/"
style="text-decoration: none; font-size: 10px; margin: 0;"
>
<img src="https://pikwizard.com/pw/medium/f6d107334caf30b5bcec7c42cddcd326.jpg" style="margin: 0; width: 100%;" alt="" />
<p style="font-size: 12px; margin: 0;">PikWizard</p>
</a>
</span>
</span>
Free (free of charge)
Free for personal and commercial use.
Author: Awesome Content