- Home >
- Stock Photos >
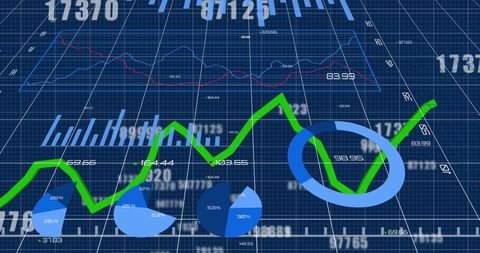
- Dynamic Financial Chart Display with Data Analytics Elements
Dynamic Financial Chart Display with Data Analytics Elements Image
Scene shows a dynamic financial chart on a digital interface with highlighted candlestick bars, percentage statistics, and line graphs. Suitable for use in presentations on finance, investments, or data analytics. Ideal for illustrating concepts related to business strategy, digital technology, and economic trends.

downloads
Tags:
More
Credit Photo
If you would like to credit the Photo, here are some ways you can do so
Text Link
photo Link
<span class="text-link">
<span>
<a target="_blank" href=https://pikwizard.com/photo/dynamic-financial-chart-display-with-data-analytics-elements/35d48f0838372dbd21b230c1518dbe44/>PikWizard</a>
</span>
</span>
<span class="image-link">
<span
style="margin: 0 0 20px 0; display: inline-block; vertical-align: middle; width: 100%;"
>
<a
target="_blank"
href="https://pikwizard.com/photo/dynamic-financial-chart-display-with-data-analytics-elements/35d48f0838372dbd21b230c1518dbe44/"
style="text-decoration: none; font-size: 10px; margin: 0;"
>
<img src="https://pikwizard.com/pw/medium/35d48f0838372dbd21b230c1518dbe44.jpg" style="margin: 0; width: 100%;" alt="" />
<p style="font-size: 12px; margin: 0;">PikWizard</p>
</a>
</span>
</span>
Free (free of charge)
Free for personal and commercial use.
Author: Authentic Images