1. Home > 
  2. Stock Photos > 
  3. Dynamic Financial Chart on Futuristic Digital Interface

Dynamic Financial Chart on Futuristic Digital Interface Image

Dynamic Financial Chart on Futuristic Digital Interface

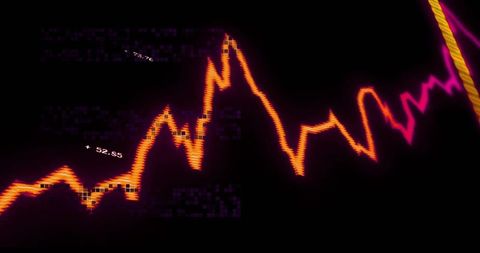
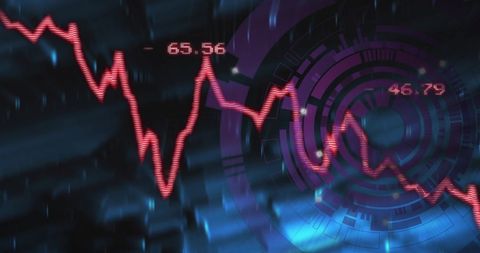
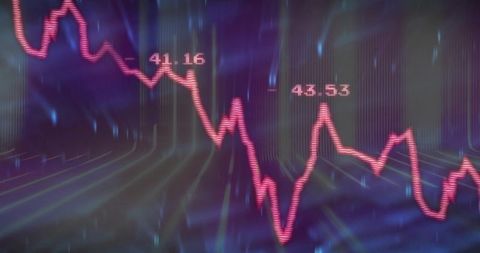
This visual of a red financial chart against a futuristic blue digital background highlights trending data points and analytics. Ideal for use in presentations about financial technology, investment strategies, market trends, and data-driven decision making.

Powered by Adobe logo
Abstract financial data chart with glowing digital lines, futuristic stock market analytics background, big data visualization, blockchain economy, business growth and technology concept - Powered by AdobeBusinessman using computer mouse and keyboard to analyze financial data, market growth, and investment charts on a transparent interface. - Powered by AdobeAbstract digital stock market chart with glowing blue lines and bokeh effects representing financial growth and analysis. - Powered by AdobeStock market investment trading graph growth Transparent.Trade business analytics graph and financial chart.PNG chart graph business.	 - Powered by AdobeBusinessman interacting with digital forex and stock market chart interface showing buy and sell decisions with futuristic holographic data overlay. - Powered by Adobe

Credit Photo

If you would like to credit the Photo, here are some ways you can do so

Free (free of charge)

Free for personal and commercial use.

Author: Awesome Content

Similar Free Stock Images

Dynamic Financial Growth Representing Business Trends
Premium
Digital forest data analysis with glowing charts and bar graphs. Abstract concept of environmental economics finance and tech, showing growth and trends in nature.
Global Economy Downtrend Concept with Earth and Declining Graph
Premium
data analytics dashboard, charts on screen during business meeting
Dynamic Stock Market Chart with Fluctuating Trends and Data Points
Futuristic Digital Interface with Dynamic Financial Graph
Financial Growth Chart Overlay on City Skyline
Dynamic Financial Data Analysis with Graph Overlays
Premium
Modern 3d illustration of a financial analytics dashboard showcasing upward trend graph pie charts and bar charts in light blue on white background
Premium
Business scalability concept with holographic charts
Financial Growth Data Overlay on Urban Skyline
Dynamic Stock Market Graph Displaying Surging Growth
Futuristic Financial Data Analysis with Rising White Line Graph
Premium
Business professional reviewing analytics charts and graphs on a digital tablet screen, sitting at a wooden desk with a steaming coffee cup and notebook, working on finances
Global Data Processing with Cloud Computing Technologies
Futuristic Data Analytics Concept with Glowing Line Graph
Stagflation Concept with Digital Graphs and Data Patterns
Dynamic Stock Market Data Visualization on Digital Interface Background
Premium
Businessman using AI predictive analytics with futuristic data visualization, graphs, and charts for business intelligence and technology solutions.
Dynamic Financial Data Analytics Interface with Blue Background
Dynamic Growth Chart with Rising Arrows in Green Tones
Abstract Financial Market Trends with Urban Lights
Cryptocurrency Data with Digital Analytics Overlay
Premium
Businessman pointing at a tablet with financial charts isolated on transparent background
Digital Financial Data Overlaying City Skyline at Dusk
Dynamic Digital Financial Data Interface Background
Abstract Stock Market Data with Growing Graph
Financial Data Visualizations Expert Economic Impact on Urban Skyline
Premium
Modern analytics dashboard filled with charts and gauges, communicating business intelligence, KPIs, and real time insight for strategic management and operational performance.
Digital Data Wave Over Circular Geometric Pattern
Dynamic Financial Data Visualization with Blue Trends
Futuristic Data Analysis Overlaying Cityscape Digital Interface
Global Financial Data Analysis with Colorful Graphs
Dynamic Financial Graphs Displaying Market Trends
Dynamic Colorful Waves on Black Digital Background
Declining Stock Market Graph on Digital Background
Global Finance and Data Analytics in Server Environment
Premium

Dynamic blue and green digital stock market graph with bar charts and lines on a dark background, representing financial data analysis, investment trends, business growth, and global economy fluctuat
Premium
Manager touches growth graph on analytics dashboard. Business data analysis reports with marketing finance management strategy. Digital charts graphs increase business performance, sales statistic
Abstract Financial Stock Market Graph Overlay on Digital Interface
Global Data Analytics and Stock Market Visual Interface
Futuristic Digital Waves Illustrating Complex Data Technology
Dynamic Financial Market Graph Amidst Digital Equations
Premium
Digital user interface background with futuristic target circles data charts and holographic elements on dark screen for cyber security and high tech information display hud dashboard concept visual
Graphical Stock Data Overlapped on Urban Architecture
Dynamic Financial Data Visualization with Abstract Graph
Digital Financial Data Visualization with Graph and Metrics
Fluctuating Financial Graph with Red Line on Green Grid
Premium
Modern laptop displaying colorful financial data and charts
Digital Representation of Inflation with Financial Data Overlay
Digital Interface with Global Business Data Analytics
Dynamic Glowing Digital Graphs on 3D Grid Background
Colorful Light Trails over Digital Data on Dark Background
Premium
Big data technology data science analysis artificial intelligence generative ai deep learning machine learning algorithm neural flow network analytics innovation abstract futuristic. 3d rendering.
Neon Glitch Market Waveform Showing Volatile Financial Chart with Glowing Scanlines
Global Data Analytics on Digital Grid Interface
Financial Data Charts in Shimmering Blue Digital Space
Digital Interface Showing Rising Stock Market Trends
Premium
A vibrant blue bar chart displays increasing financial data overlaid with a glowing yellow line graph showing a positive upward trend symbolizing economic progress and investment success
Digital Interface with Financial Data and Network Cables
Declining Stock Market Graph on Dotted Grid Background
Futuristic Global Business Data and Interface Diagram
Data Analytics and Business Strategy Network Interface
Futuristic Stock Market Data Visualization with Graphs
Premium
Financial Stock Market Data Analysis with Upward Trending Graphs and Bars financial data chart
Dynamic Financial Data Analytics Display on Dark Background
Premium
Laptop displaying financial data and charts on screen, representing business analytics and investment strategies, isolated on transparent background
Abstract Digital Financial Chart on Blue Background
Abstract Financial Chart Technology Interface
Global Stock Market Decline Concept with Graph and Digital Globe
Data Visualization Overlay on Urban Cityscape
Dynamic Stock Market Data on Digital Interface
Digital Earth with Global Business Data Analysis Interface
Financial Data Overlay on Cityscape Visualizing Market Trends
Global Financial Data Visualization with Digital Overlays
Dynamic Financial Graph with Rising Trend on Blue Background
Premium
An Analyst uses a computer and dashboard for data business analysis and Data Management System with KPI to report. Database for technology finance, operations, sales, marketing and SEO
Dynamic Financial Graph with Global Data Overlay
Digital World Map with Dynamic Financial Analysis Overlay
Digital Data Security and Cloud Computing Concept
Futuristic Analytics Graph with Cyan-Orange Line Trends
Premium
Dynamic digital financial graph with glowing purple and blue trend lines on dark background displaying market analytics data for investment technology
Dynamic Graph with Vibrant Lines on Black Background
Dynamic Financial Stock Market Data Analysis
Abstract Financial Data Graphics Illustrating Analysis
Global Financial Data Analysis with Digital Earth Visualization
Premium
Transparent or png stock market investment trading graph growth.Trade business analytics graph and financial chart.
Abstract Financial Graph on Dark Digital Background
Red Market Line Graph Showing Financial Fluctuations with Upward Arrows and Data Points
Financial Chart and Rotating Globe on Digital Grid Background
Futuristic Graph and Data Technology Interface
Global Data Visualization With Dynamic Graphs and World Map Background
Dynamic Financial Stock Market Graph
Fluctuating Stock Market Graph with Dramatic Peaks
Futuristic Data Visualization on Global Map Interface
Financial Data Displayed Over City Skyline with Rising Graphs
Financial Data with World Map and Digital Waves
Abstract Technology Finance Graph on Digital Interface
Global Business Dashboard Overlay on Urban Skyline Background
Dynamic Stock Market Graph with Green Arrows and Numbers
Abstract Financial Data with Dynamic Graphs on Blue Background
Upward Stock Market Arrow with Binary Code Background
Dynamic Stock Market Visual in Modern Office Setting
Rising Financial Market Trends with Data Visualization
Premium
AI finance business data analysis digital technology investment trading market stock, financial analyst using advanced holographic interface for global market insight, smart investment strategy
Rising Financial Data Highlights Global Economic Growth
Digital Interface with Data Processing and Security Elements
Rotating holographic globe with neon line chart visualizing global market data trends
Colorful Data Chart Over Blue Background
Premium
Data analytics and big data strategy for real-time analytics, predictive data modeling, business intelligence analytics, and data-driven decision-making in modern digital businesses. Thunk
Abstract Digital Interface with Fluctuating Line Graph
Futuristic Neon Line Graphs Weaving Over Perspective Grid Dashboard for Fintech Analytics
Cybersecurity Analysis Interface with Data Visualization
Financial Data Analysis with Declining Trends
Premium
Data analysis Holographic projection showing graphs and charts on tablet with cityscape in background modern technology concept
Dynamic Financial Market Trends with Data Visualizations
Digital Financial Data Analysis With Declining Graph
Abstract Digital Finance and Data Interconnectivity Background
Dynamic Global Market Trends Over World Map Visualization
Premium
Business analytics concept with person analyzing upward financial growth on laptop using digital charts and arrows on futuristic background.
Futuristic Stock Market Graph With Digital Overlay
Digital Financial Graph with Dynamic Trading Analysis
Surprising Drop in Digital Stock Market Chart Visualization
Premium
Futuristic Fitness Technology: A runner with leggings and teal sneakers, showing data visualizations and analytics while exercising outdoors on a sunny day
Premium
Hands typing on a laptop with futuristic glowing blue digital data charts and graphs overlay
Explore More Free Stock Images