- Home >
- Stock Photos >
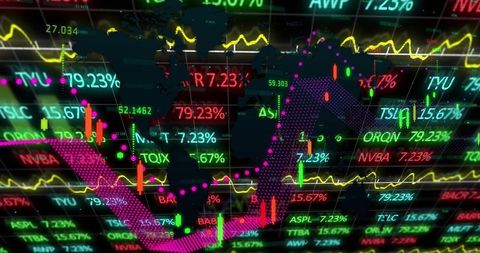
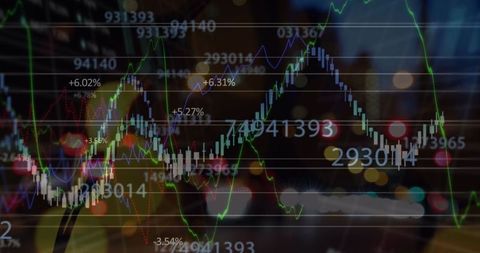
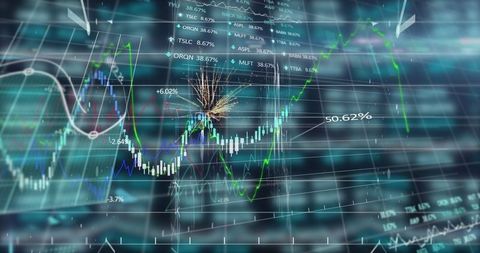
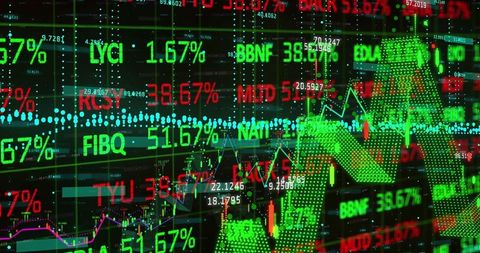
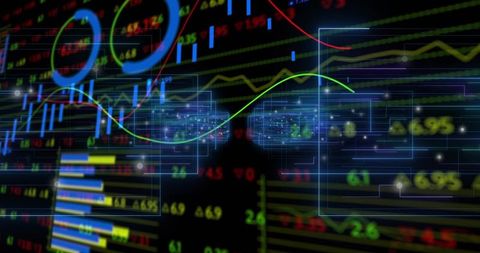
- Dynamic Financial Chart Visualization with Candlestick and Dotted Graphs
Dynamic Financial Chart Visualization with Candlestick and Dotted Graphs Image
Image showcasing dynamic financial data with candlestick charts and dotted trend lines, ideal for illustrating concepts of stock market analysis, investment strategies, and economic patterns. Useful for financial professionals, traders, and investment marketers aiming to demonstrate market trends, provide insight into data analytics, or create presentations on economic growth and stock performance. Perfect for articles, educational materials, and corporate communications related to finance and investments.

downloads
Tags:
More
Credit Photo
If you would like to credit the Photo, here are some ways you can do so
Text Link
photo Link
<span class="text-link">
<span>
<a target="_blank" href=https://pikwizard.com/photo/dynamic-financial-chart-visualization-with-candlestick-and-dotted-graphs/0f15693851b76c9a3f7c774d46a5cc7a/>PikWizard</a>
</span>
</span>
<span class="image-link">
<span
style="margin: 0 0 20px 0; display: inline-block; vertical-align: middle; width: 100%;"
>
<a
target="_blank"
href="https://pikwizard.com/photo/dynamic-financial-chart-visualization-with-candlestick-and-dotted-graphs/0f15693851b76c9a3f7c774d46a5cc7a/"
style="text-decoration: none; font-size: 10px; margin: 0;"
>
<img src="https://pikwizard.com/pw/medium/0f15693851b76c9a3f7c774d46a5cc7a.jpg" style="margin: 0; width: 100%;" alt="" />
<p style="font-size: 12px; margin: 0;">PikWizard</p>
</a>
</span>
</span>
Free (free of charge)
Free for personal and commercial use.
Author: People Creations