- Home >
- Stock Photos >
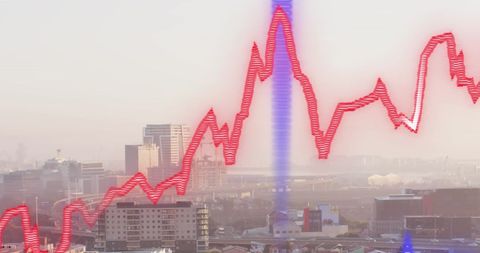
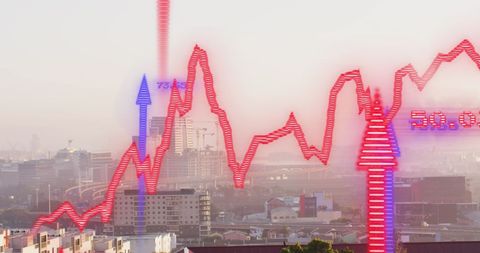
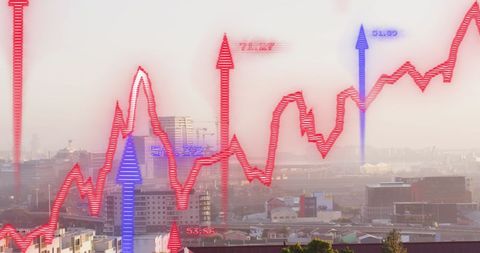
- Dynamic Financial Chart with Arrow Highlights
Dynamic Financial Chart with Arrow Highlights Image

Illustration showing a financial chart with red and blue arrows signifying movement on the stock market. This abstract financial graphic is suitable for technology, finance, and business presentations. It can also be used in articles or reports dealing with market analysis, economic growth seminars, or investment technology webinars.

downloads
Tags:
More
Credit Photo
If you would like to credit the Photo, here are some ways you can do so
Text Link
photo Link
<span class="text-link">
<span>
<a target="_blank" href=https://pikwizard.com/photo/dynamic-financial-chart-with-arrow-highlights/b54fdbd031cc1c0c48ca74d760060176/>PikWizard</a>
</span>
</span>
<span class="image-link">
<span
style="margin: 0 0 20px 0; display: inline-block; vertical-align: middle; width: 100%;"
>
<a
target="_blank"
href="https://pikwizard.com/photo/dynamic-financial-chart-with-arrow-highlights/b54fdbd031cc1c0c48ca74d760060176/"
style="text-decoration: none; font-size: 10px; margin: 0;"
>
<img src="https://pikwizard.com/pw/medium/b54fdbd031cc1c0c48ca74d760060176.jpg" style="margin: 0; width: 100%;" alt="" />
<p style="font-size: 12px; margin: 0;">PikWizard</p>
</a>
</span>
</span>
Free (free of charge)
Free for personal and commercial use.
Author: Awesome Content