- Home >
- Stock Photos >
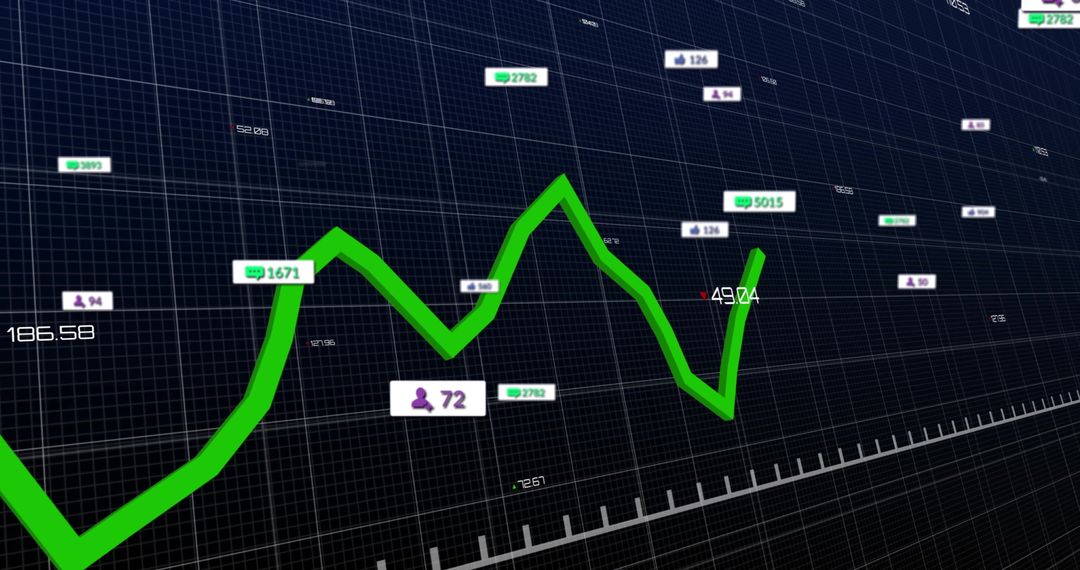
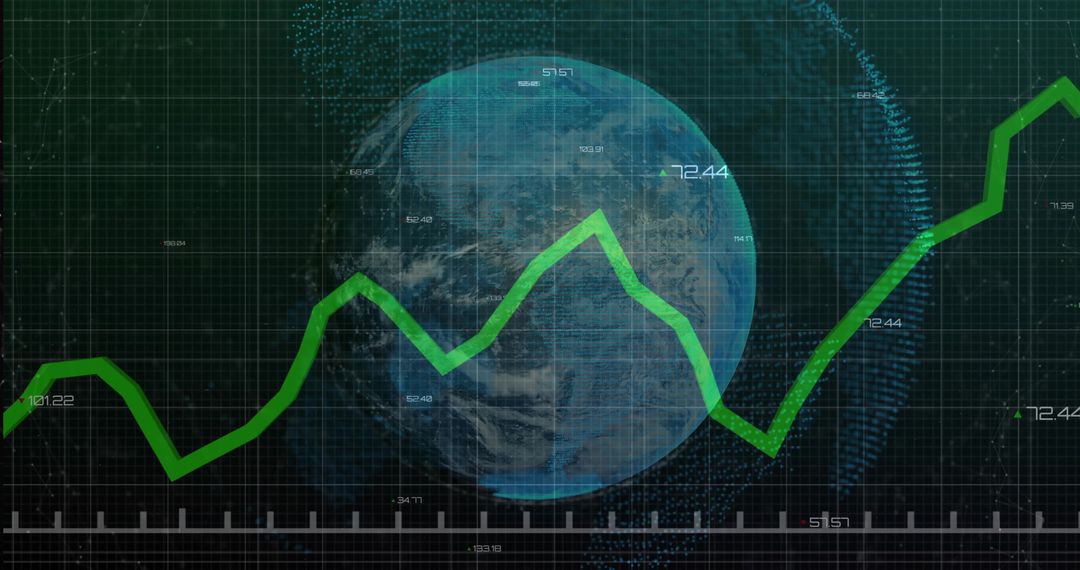
- Dynamic Financial Chart with Currency Symbols and Digital Network
Dynamic Financial Chart with Currency Symbols and Digital Network Image

This visualization captures the essence of market volatility and investment analyses through a dynamic green line chart intertwined with digital currency symbols and network graphics. Ideal for articles or content centered on trading insights, stock market presentations, or reports on financial trends. It underscores themes of digital investment strategies, fintech developments, and global economic connectivity. Useful for conveying data-driven decisions and analyses in corporate presentations or financial assessments.
Powered by  - Get 15% off with code: PIKWIZARD15


0
downloads
downloads
Tags:
More
Credit Photo
If you would like to credit the Photo, here are some ways you can do so
Text Link
photo Link
<span class="text-link">
<span>
<a target="_blank" href=https://pikwizard.com/photo/dynamic-financial-chart-with-currency-symbols-and-digital-network/fa098895bcf4312c04a784870cfdc5c9/>PikWizard</a>
</span>
</span>
<span class="image-link">
<span
style="margin: 0 0 20px 0; display: inline-block; vertical-align: middle; width: 100%;"
>
<a
target="_blank"
href="https://pikwizard.com/photo/dynamic-financial-chart-with-currency-symbols-and-digital-network/fa098895bcf4312c04a784870cfdc5c9/"
style="text-decoration: none; font-size: 10px; margin: 0;"
>
<img src="https://pikwizard.com/pw/medium/fa098895bcf4312c04a784870cfdc5c9.jpg" style="margin: 0; width: 100%;" alt="" />
<p style="font-size: 12px; margin: 0;">PikWizard</p>
</a>
</span>
</span>
Free (free of charge)
Free for personal and commercial use.
Author: People Creations
Similar Free Stock Images

Premium


Premium


Premium


Premium


Premium


Premium


Premium


Premium


Premium


Premium


Premium


Premium


Premium


Premium


Premium


Premium


Premium


Premium


Premium


Premium


Premium


Premium


Premium


Premium