
- Home >
- Stock Photos >
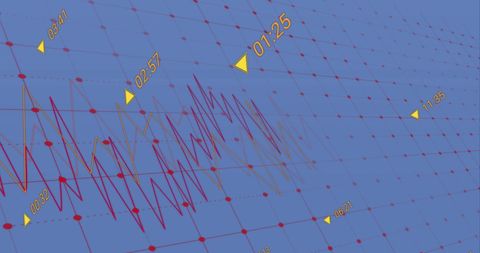
- Dynamic Financial Chart with Data Points and Growth Indicators
Dynamic Financial Chart with Data Points and Growth Indicators Image
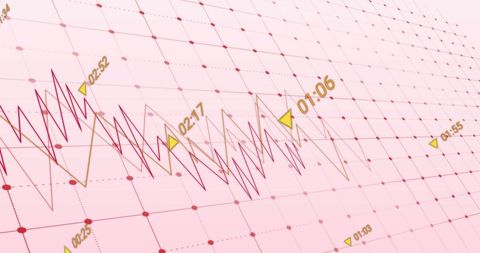
This image features a dynamic financial chart complete with changing numbers and graphs against a pink background. Ideal for illustrating economic trends, report presentations, and digital advantages in financial technology. Useful in business and statistics demonstrations highlighting report and data visualization elements. Perfect for online articles about market growth, economic projections, and business forecasting strategies.
Powered by 


downloads
Tags:
More
Credit Photo
If you would like to credit the Photo, here are some ways you can do so
Text Link
photo Link
<span class="text-link">
<span>
<a target="_blank" href=https://pikwizard.com/photo/dynamic-financial-chart-with-data-points-and-growth-indicators/554eef4bb9dc3e22df4c12975d8764dc/>PikWizard</a>
</span>
</span>
<span class="image-link">
<span
style="margin: 0 0 20px 0; display: inline-block; vertical-align: middle; width: 100%;"
>
<a
target="_blank"
href="https://pikwizard.com/photo/dynamic-financial-chart-with-data-points-and-growth-indicators/554eef4bb9dc3e22df4c12975d8764dc/"
style="text-decoration: none; font-size: 10px; margin: 0;"
>
<img src="https://pikwizard.com/pw/medium/554eef4bb9dc3e22df4c12975d8764dc.jpg" style="margin: 0; width: 100%;" alt="" />
<p style="font-size: 12px; margin: 0;">PikWizard</p>
</a>
</span>
</span>
Free (free of charge)
Free for personal and commercial use.
Author: Creative Art
Similar Free Stock Images

Premium


Premium


Premium


Premium

Premium

Premium


Premium


Premium


Premium


Premium

Premium

Premium


Premium


Premium


Premium

Premium


Premium
Premium


Premium


Premium


Premium
Premium


Premium


Premium


Premium


Explore More Free Stock Images