
- Home >
- Stock Photos >
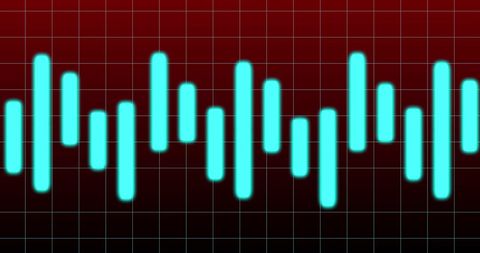
- Dynamic Financial Chart with Glowing Pulse Indicators
Dynamic Financial Chart with Glowing Pulse Indicators Image
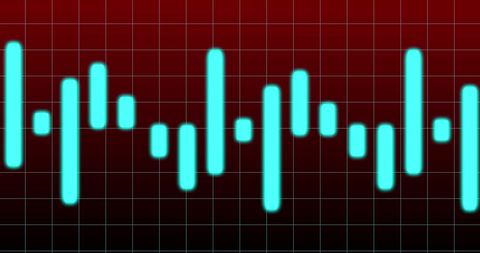
Illustrating the concept of modern finance, this graphic showcases a digital dynamic chart with glowing blue pulse lines against a grid with a red and black backdrop. Perfect for use in content related to the stock market, economic analysis, and technological advancements in finance. It can enhance presentations or articles discussing market trends, statistics, projections, and investment strategies.
Powered by 


downloads
Tags:
More
Credit Photo
If you would like to credit the Photo, here are some ways you can do so
Text Link
photo Link
<span class="text-link">
<span>
<a target="_blank" href=https://pikwizard.com/photo/dynamic-financial-chart-with-glowing-pulse-indicators/a7c8d04e0f10967181e77a7cf79ddf3e/>PikWizard</a>
</span>
</span>
<span class="image-link">
<span
style="margin: 0 0 20px 0; display: inline-block; vertical-align: middle; width: 100%;"
>
<a
target="_blank"
href="https://pikwizard.com/photo/dynamic-financial-chart-with-glowing-pulse-indicators/a7c8d04e0f10967181e77a7cf79ddf3e/"
style="text-decoration: none; font-size: 10px; margin: 0;"
>
<img src="https://pikwizard.com/pw/medium/a7c8d04e0f10967181e77a7cf79ddf3e.jpg" style="margin: 0; width: 100%;" alt="" />
<p style="font-size: 12px; margin: 0;">PikWizard</p>
</a>
</span>
</span>
Free (free of charge)
Free for personal and commercial use.
Author: Creative Art
Similar Free Stock Images

Premium


Premium


Premium


Premium


Premium


Premium

Premium

Premium

Premium


Premium


Premium


Premium


Premium


Premium


Premium


Premium


Premium


Premium


Premium


Premium


Premium


Premium


Premium

Premium

Premium


Explore More Free Stock Images