- Home >
- Stock Photos >
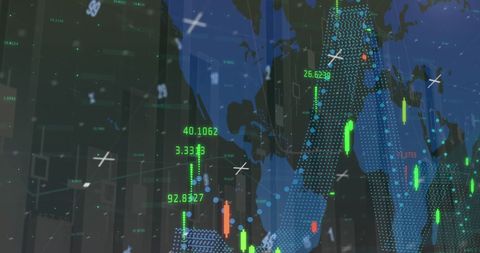
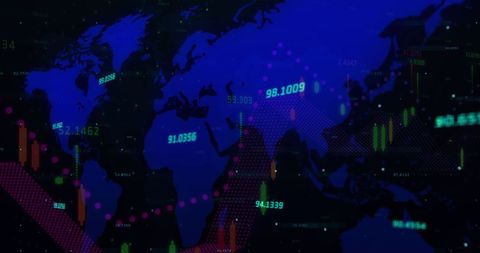
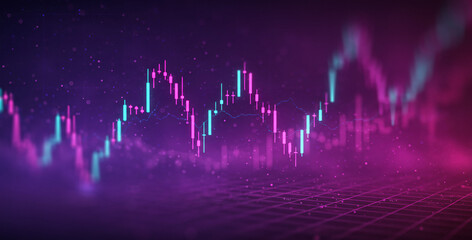
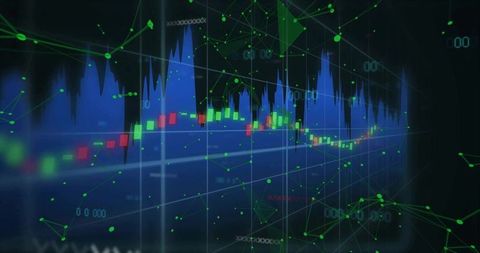
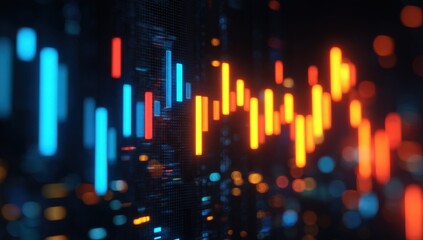
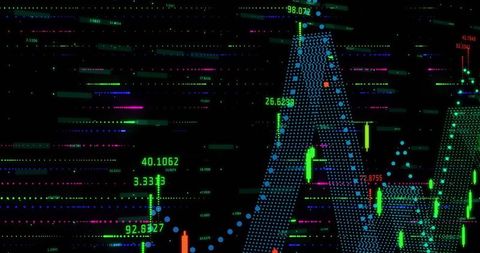
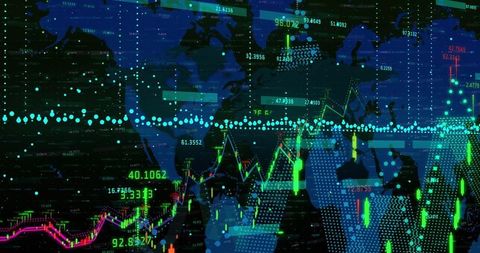
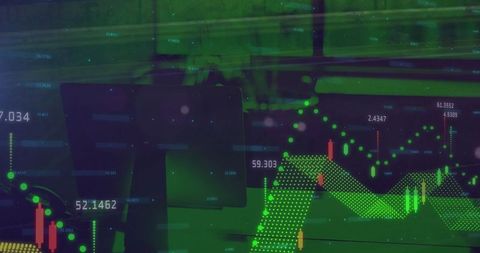
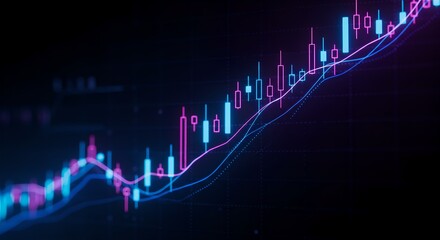
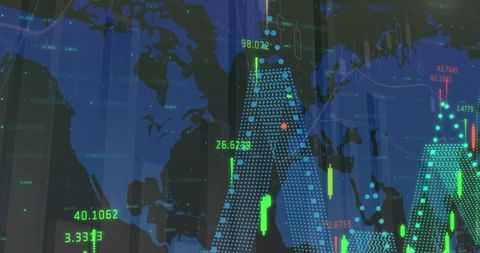
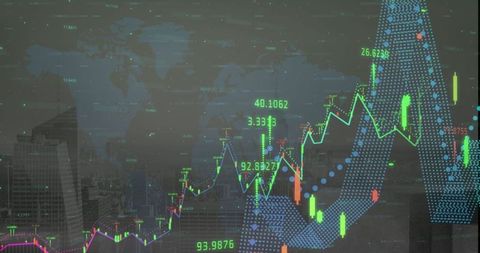
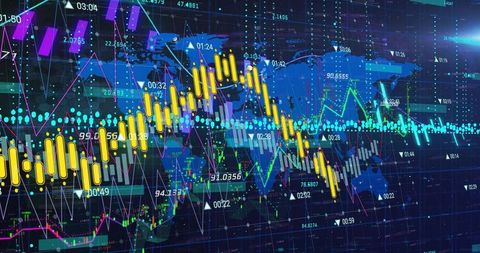
- Dynamic Financial Chart with Neon Candlestick Bars
Dynamic Financial Chart with Neon Candlestick Bars Image
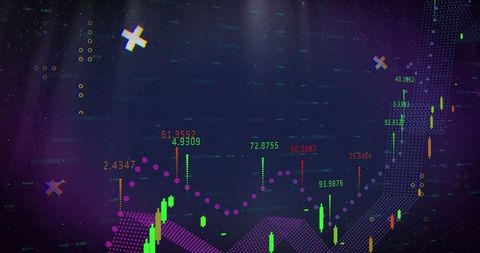
Illustrates digital financial data with neon green candlestick bars and magenta data points on a dashboard. Useful for depicting concepts in modern financial trading, investment analytics, or technology-driven progress. Ideal for use in presentations or articles discussing security trading, data interfaces, or visual analytical tools.
Powered by 


4
downloads
downloads
Tags:
More
Credit Photo
If you would like to credit the Photo, here are some ways you can do so
Text Link
photo Link
<span class="text-link">
<span>
<a target="_blank" href=https://pikwizard.com/photo/dynamic-financial-chart-with-neon-candlestick-bars/fe93128986973261ae1d509b1e1045eb/>PikWizard</a>
</span>
</span>
<span class="image-link">
<span
style="margin: 0 0 20px 0; display: inline-block; vertical-align: middle; width: 100%;"
>
<a
target="_blank"
href="https://pikwizard.com/photo/dynamic-financial-chart-with-neon-candlestick-bars/fe93128986973261ae1d509b1e1045eb/"
style="text-decoration: none; font-size: 10px; margin: 0;"
>
<img src="https://pikwizard.com/pw/medium/fe93128986973261ae1d509b1e1045eb.jpg" style="margin: 0; width: 100%;" alt="" />
<p style="font-size: 12px; margin: 0;">PikWizard</p>
</a>
</span>
</span>
Free (free of charge)
Free for personal and commercial use.
Author: People Creations
Similar Free Stock Images
Premium


Premium


Premium


Premium


Premium

Premium


Premium


Premium


Premium


Premium


Premium


Premium


Premium


Premium


Premium


Premium


Premium


Premium


Premium


Premium


Premium

Premium


Premium
Premium


Premium