- Home >
- Stock Photos >
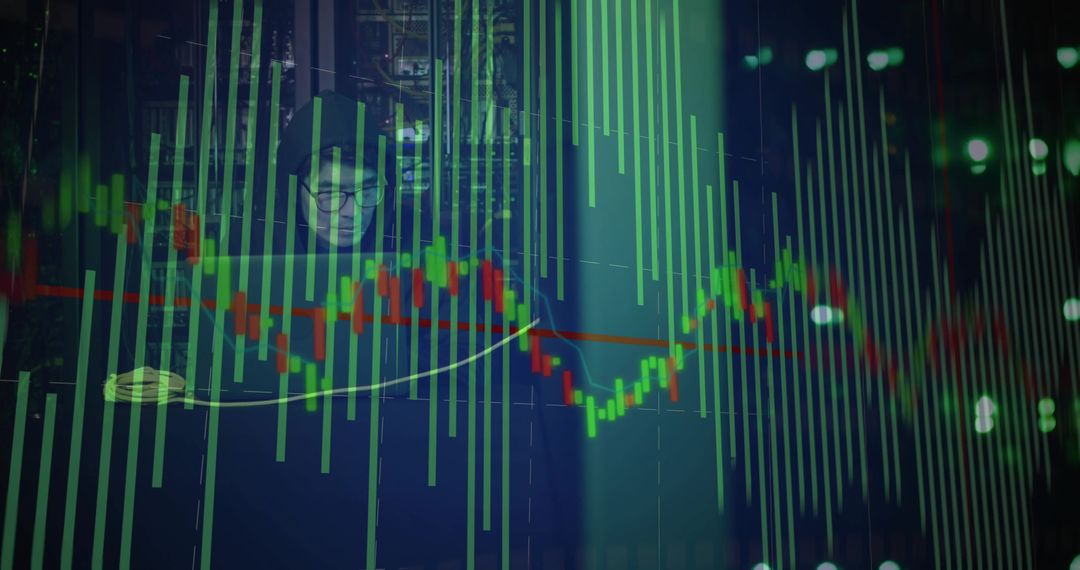
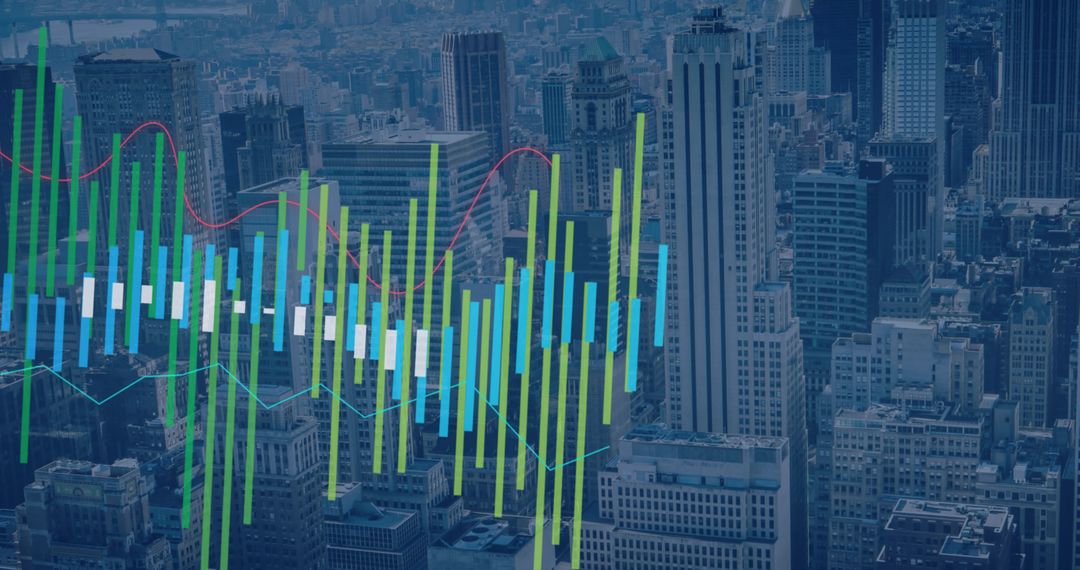
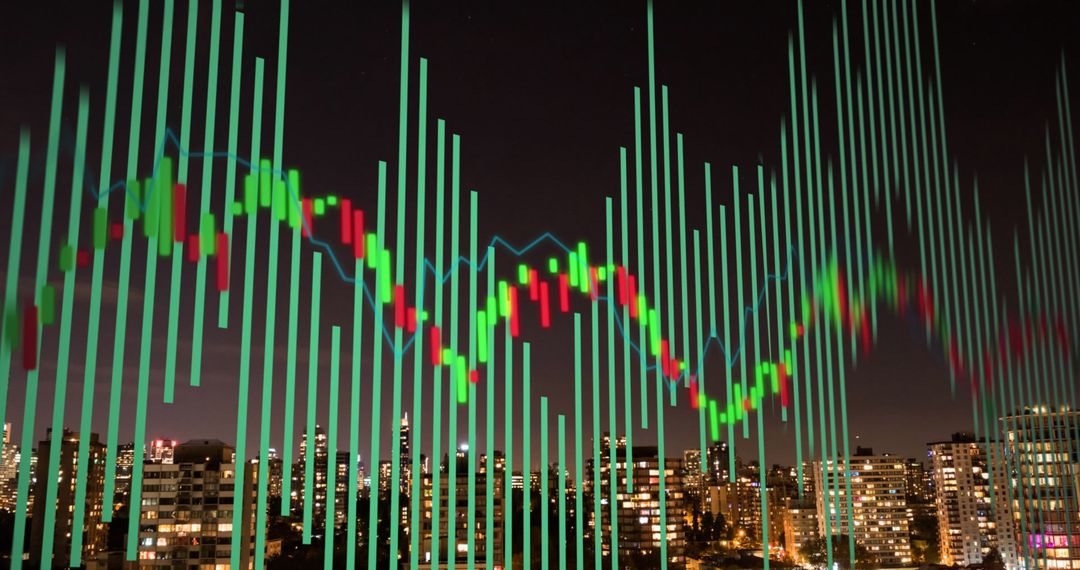
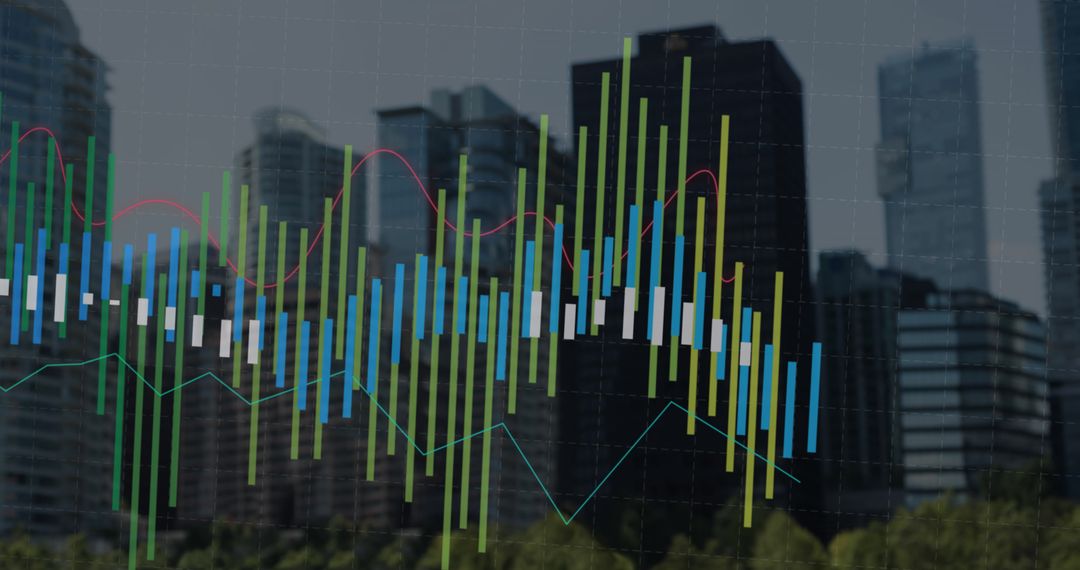
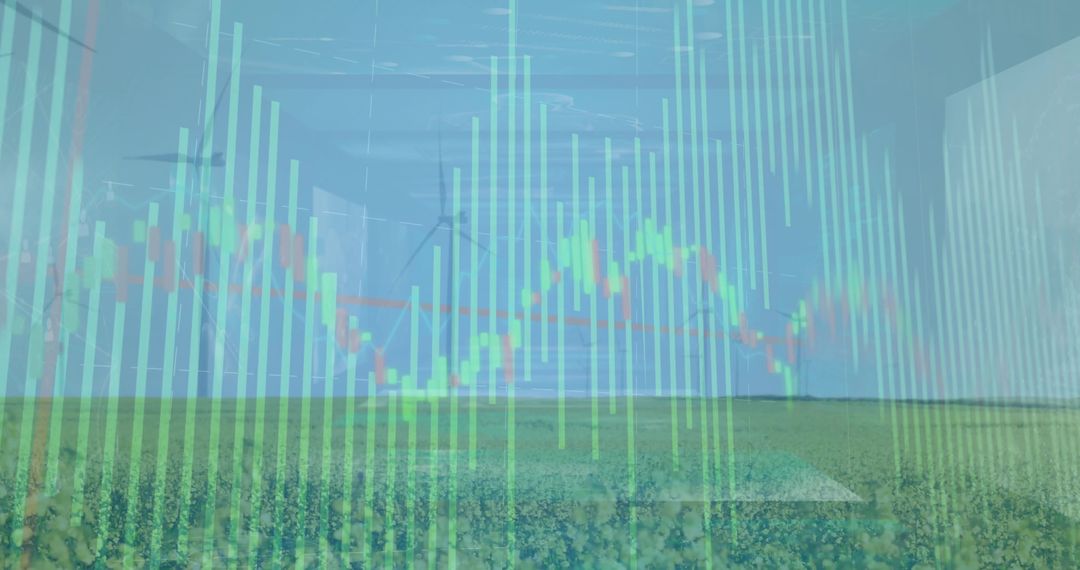
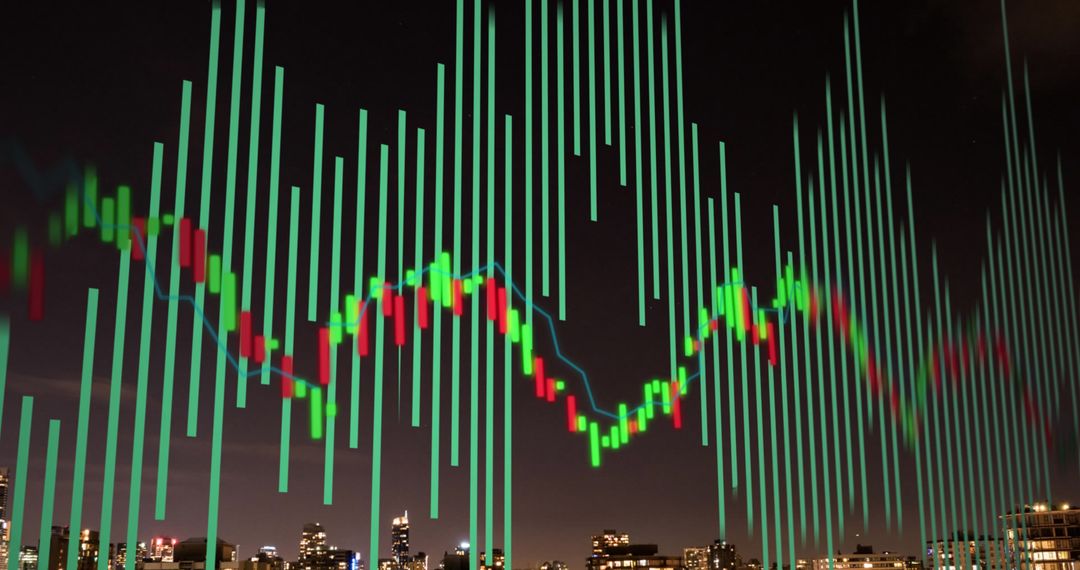
- Dynamic Financial Chart with Red Trend Line Against Urban Backdrop
Dynamic Financial Chart with Red Trend Line Against Urban Backdrop Image

Candlestick chart with a red trend line is overlaying green bars, combining financial analysis with an urban cityscape background. Ideal for presentations on stock market trends, financial insights, and trading strategies. Suitable for illustrating complex fiscal dynamics and urban integration with finance.
Powered by  - Get 15% off with code: PIKWIZARD15


0
downloads
downloads
Tags:
More
Credit Photo
If you would like to credit the Photo, here are some ways you can do so
Text Link
photo Link
<span class="text-link">
<span>
<a target="_blank" href=https://pikwizard.com/photo/dynamic-financial-chart-with-red-trend-line-against-urban-backdrop/70815798562d96b439b8e5d39542476d/>PikWizard</a>
</span>
</span>
<span class="image-link">
<span
style="margin: 0 0 20px 0; display: inline-block; vertical-align: middle; width: 100%;"
>
<a
target="_blank"
href="https://pikwizard.com/photo/dynamic-financial-chart-with-red-trend-line-against-urban-backdrop/70815798562d96b439b8e5d39542476d/"
style="text-decoration: none; font-size: 10px; margin: 0;"
>
<img src="https://pikwizard.com/pw/medium/70815798562d96b439b8e5d39542476d.jpg" style="margin: 0; width: 100%;" alt="" />
<p style="font-size: 12px; margin: 0;">PikWizard</p>
</a>
</span>
</span>
Free (free of charge)
Free for personal and commercial use.
Author: Creative Art
Similar Free Stock Images

Premium


Premium


Premium


Premium


Premium


Premium


Premium


Premium


Premium


Premium


Premium


Premium


Premium


Premium


Premium


Premium


Premium


Premium


Premium


Premium


Premium


Premium


Premium


Premium