- Home >
- Stock Photos >
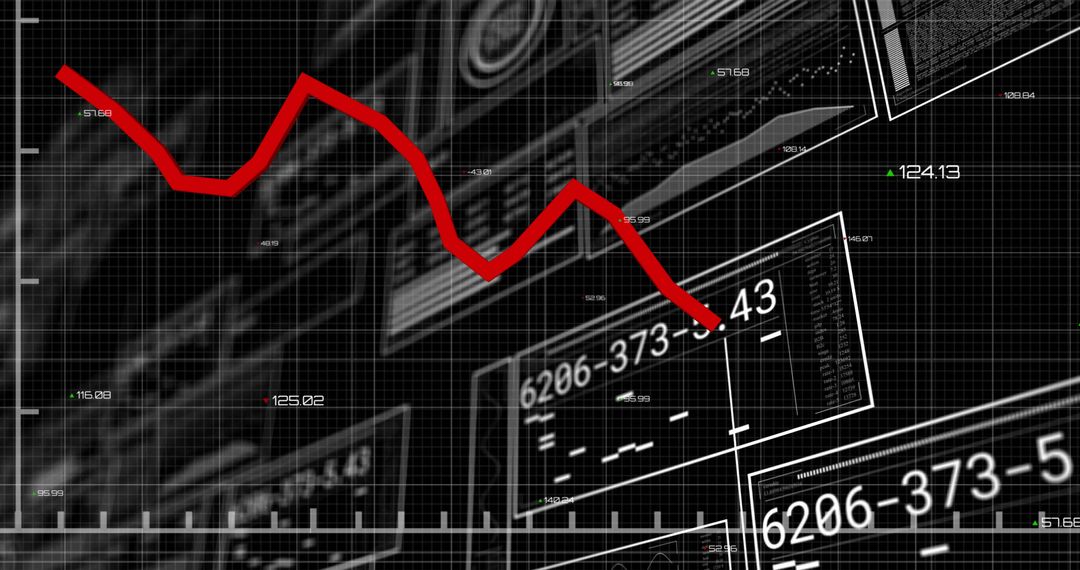
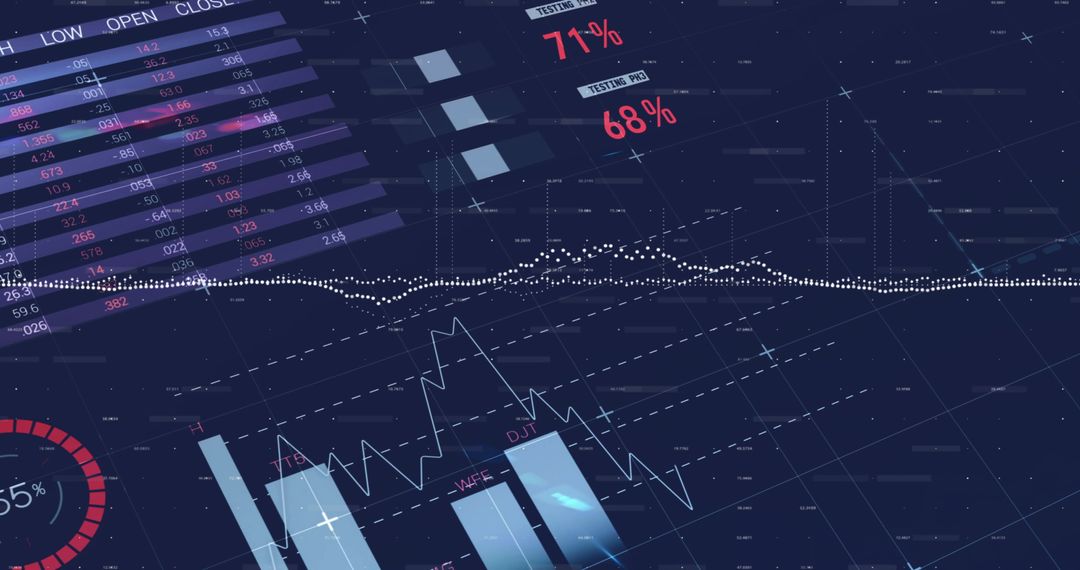
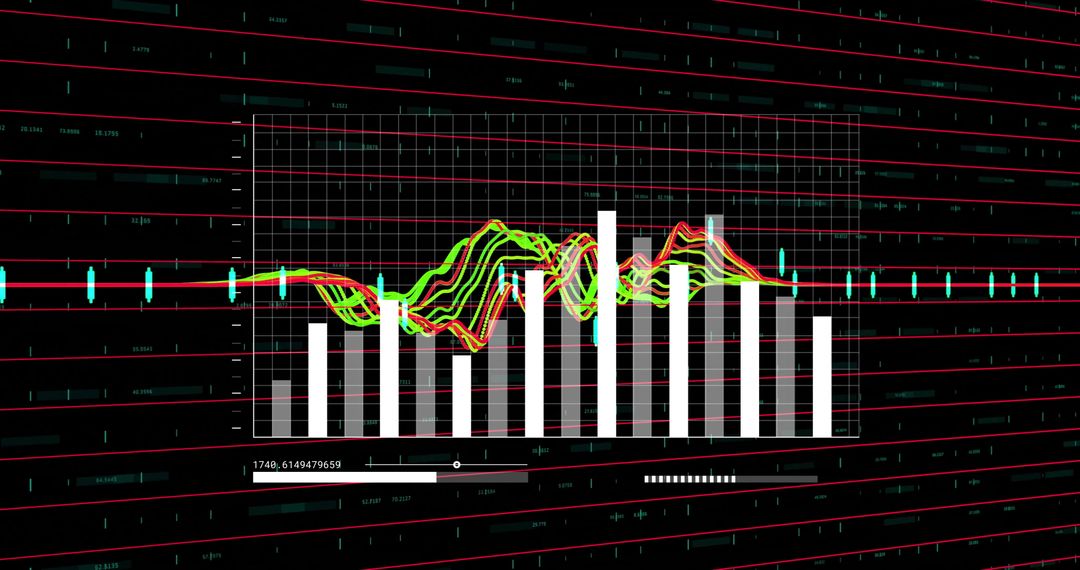
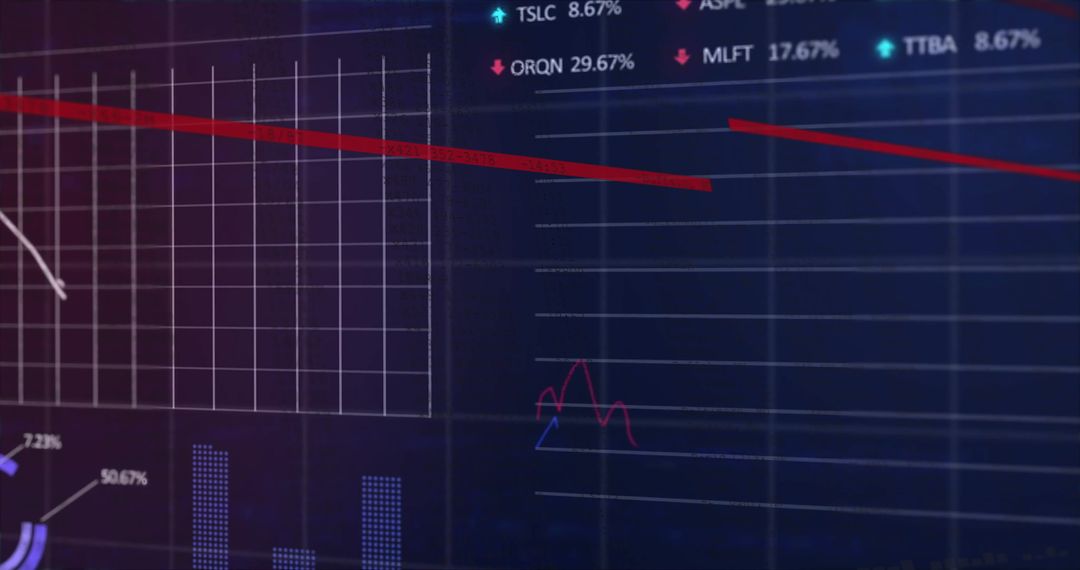
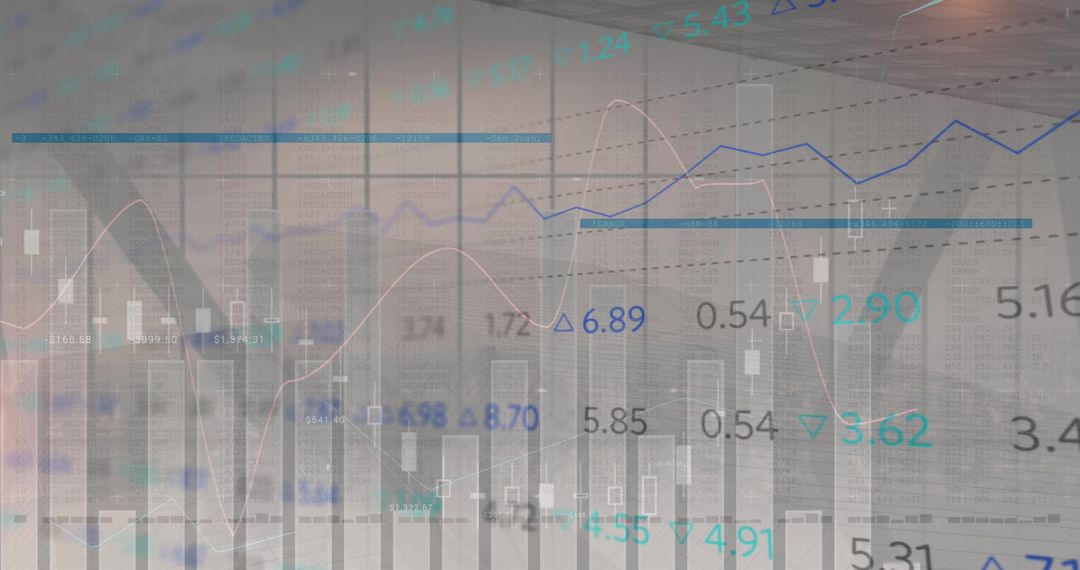
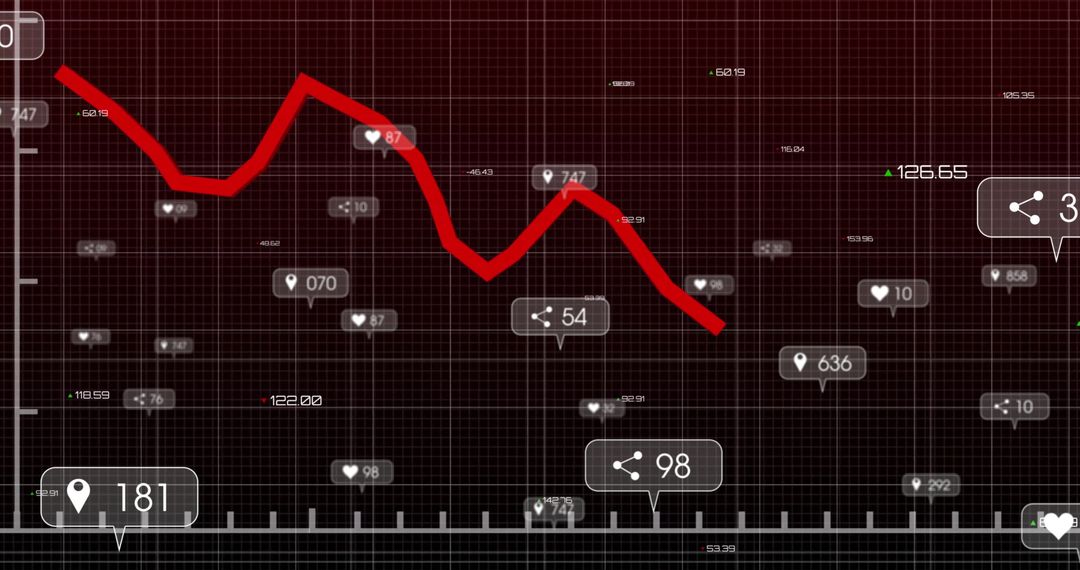
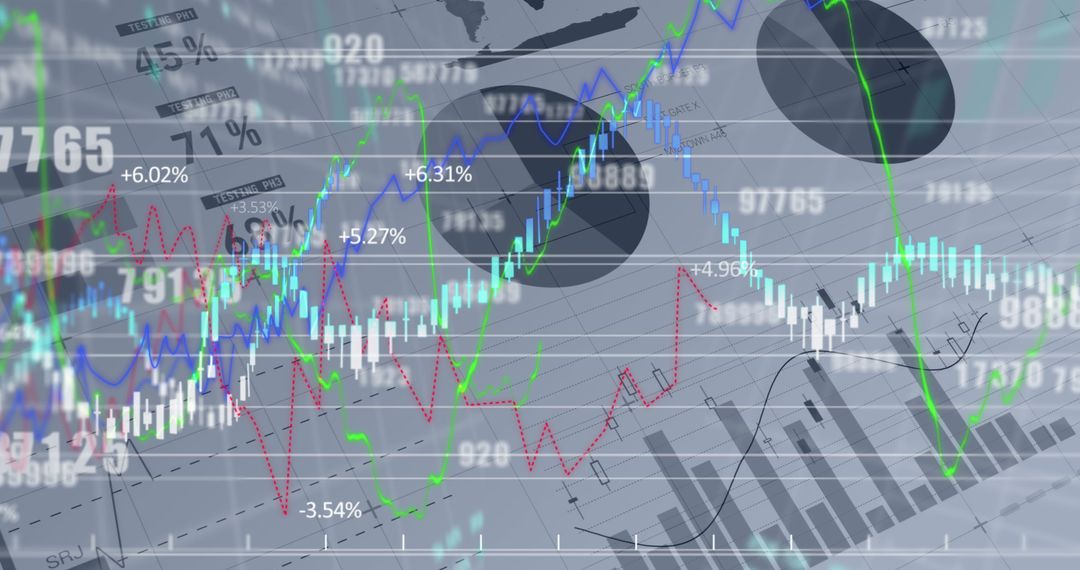
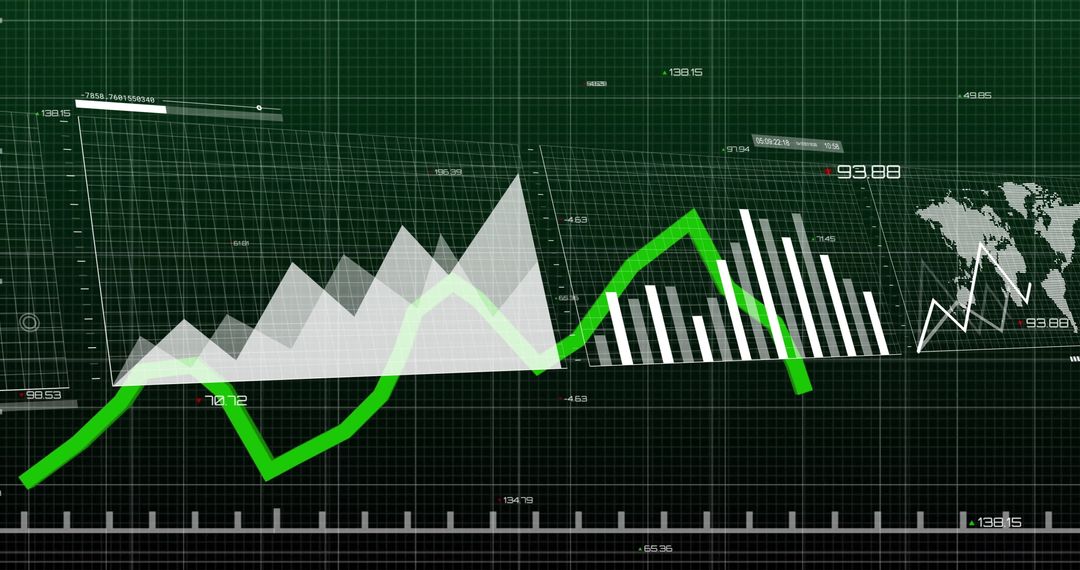
- Dynamic Financial Chart with Rising Bars and Trend Lines
Dynamic Financial Chart with Rising Bars and Trend Lines Image
The design displays financial metrics with white bars symbolizing data fluctuations against a grey grid, enhanced by a red trend line. Highlights use of digital technology in finance and investment analytics. Ideal for illustrating concepts in economic analysis, business forecasting, or trading strategies presentations.
Powered by 


0
downloads
downloads
Tags:
More
Credit Photo
If you would like to credit the Photo, here are some ways you can do so
Text Link
photo Link
<span class="text-link">
<span>
<a target="_blank" href=https://pikwizard.com/photo/dynamic-financial-chart-with-rising-bars-and-trend-lines/f4e9a58a9c16541de1883acfc0de772d/>PikWizard</a>
</span>
</span>
<span class="image-link">
<span
style="margin: 0 0 20px 0; display: inline-block; vertical-align: middle; width: 100%;"
>
<a
target="_blank"
href="https://pikwizard.com/photo/dynamic-financial-chart-with-rising-bars-and-trend-lines/f4e9a58a9c16541de1883acfc0de772d/"
style="text-decoration: none; font-size: 10px; margin: 0;"
>
<img src="https://pikwizard.com/pw/medium/f4e9a58a9c16541de1883acfc0de772d.jpg" style="margin: 0; width: 100%;" alt="" />
<p style="font-size: 12px; margin: 0;">PikWizard</p>
</a>
</span>
</span>
Free (free of charge)
Free for personal and commercial use.
Author: Creative Art
Similar Free Stock Images

Premium


Premium


Premium


Premium


Premium


Premium


Premium


Premium


Premium


Premium


Premium


Premium


Premium


Premium


Premium


Premium


Premium


Premium


Premium


Premium


Premium


Premium


Premium


Premium