
- Home >
- Stock Photos >
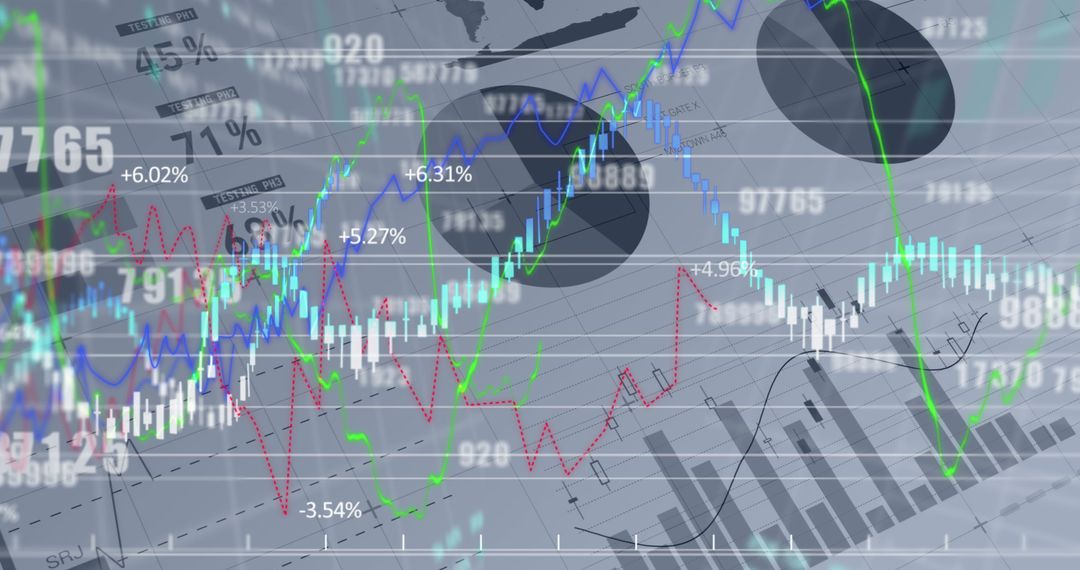
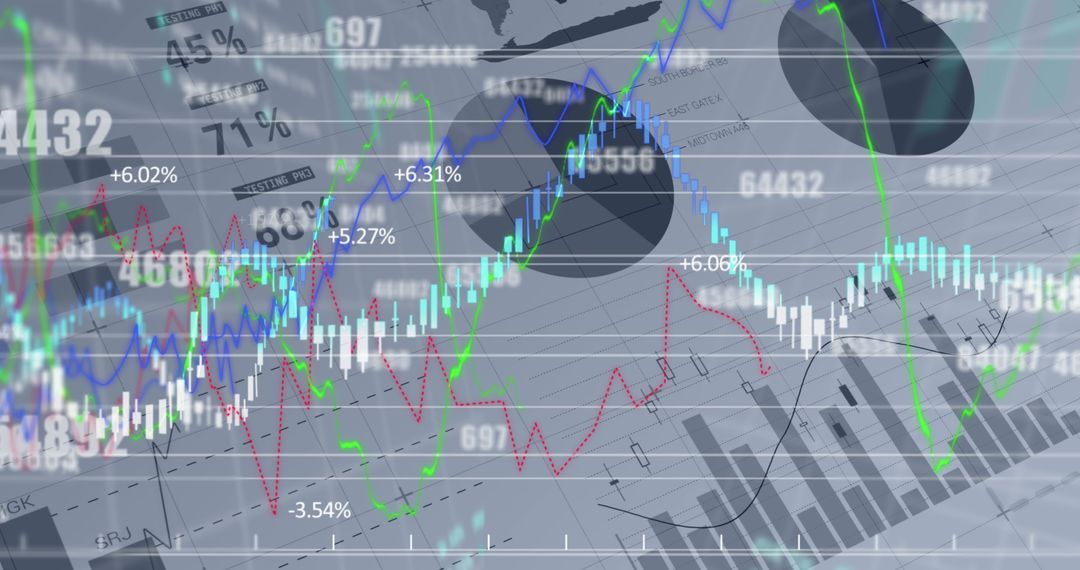
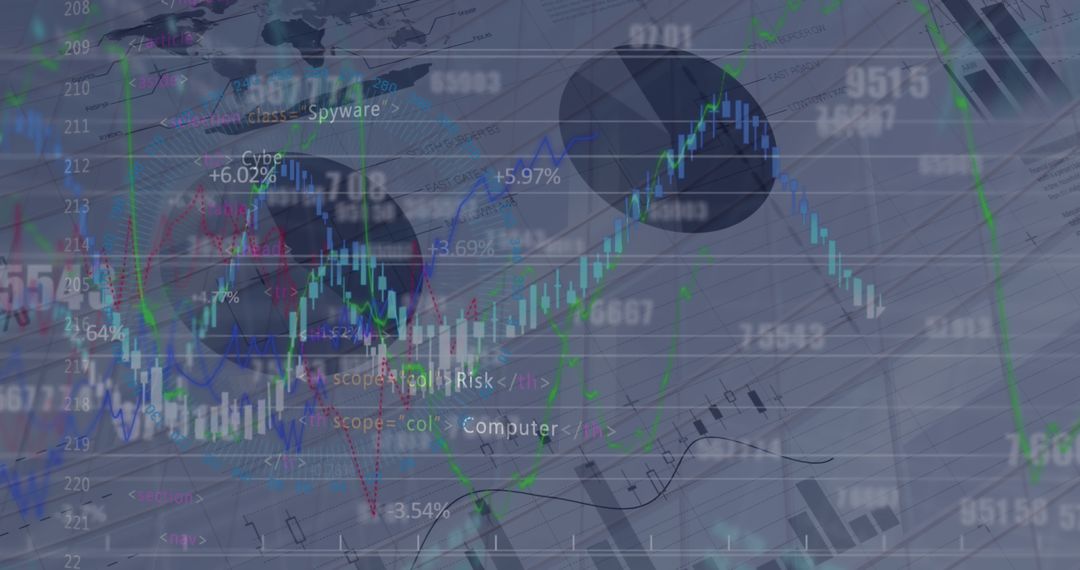
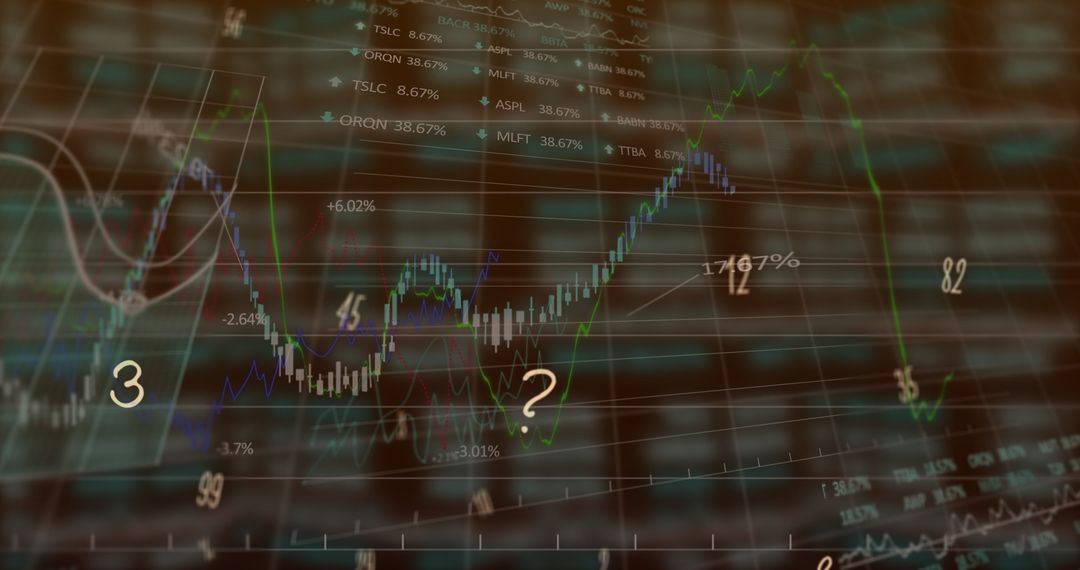
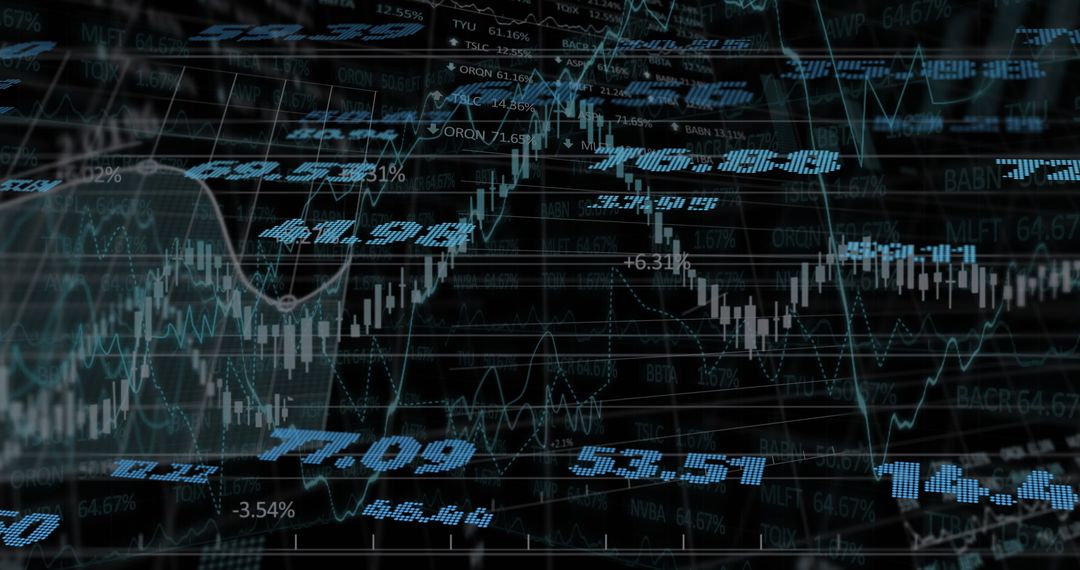
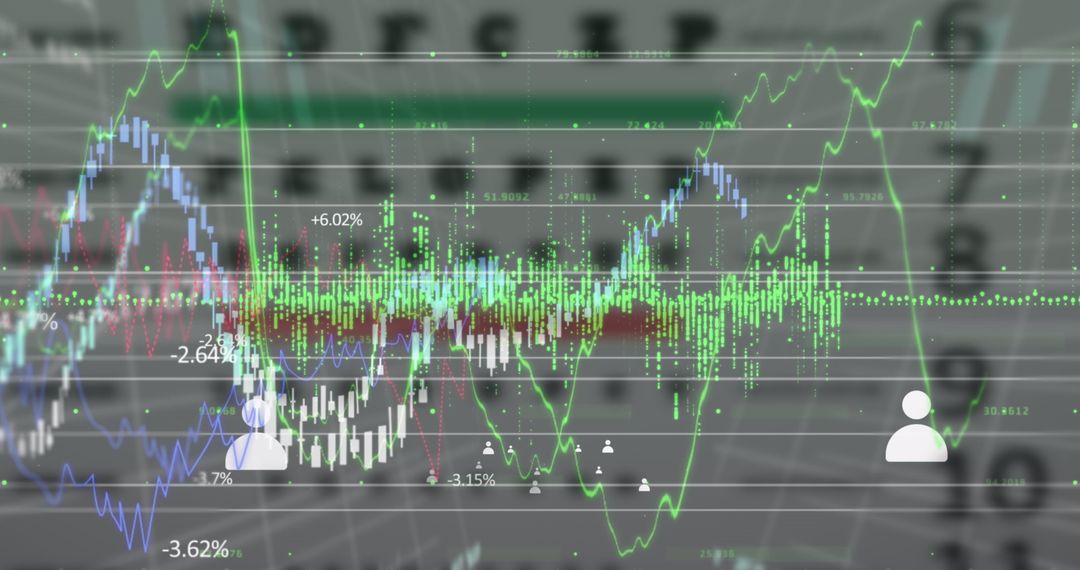
- Dynamic Financial Charts and Data for Market Analysis
Dynamic Financial Charts and Data for Market Analysis Image

This graphic art combines dynamic financial charts and data overlays representing market analysis. Ideal for use in finance-themed publications, presentations on economic trends, or as a background for technological and business development materials. Offering an abstract view of statistical performance, it captures the essence of global finance and digital analytics.
Powered by 


2
downloads
downloads
Tags:
More
Credit Photo
If you would like to credit the Photo, here are some ways you can do so
Text Link
photo Link
<span class="text-link">
<span>
<a target="_blank" href=https://pikwizard.com/photo/dynamic-financial-charts-and-data-for-market-analysis/593b4b7bdb3d3d3dea053eb2c2406440/>PikWizard</a>
</span>
</span>
<span class="image-link">
<span
style="margin: 0 0 20px 0; display: inline-block; vertical-align: middle; width: 100%;"
>
<a
target="_blank"
href="https://pikwizard.com/photo/dynamic-financial-charts-and-data-for-market-analysis/593b4b7bdb3d3d3dea053eb2c2406440/"
style="text-decoration: none; font-size: 10px; margin: 0;"
>
<img src="https://pikwizard.com/pw/medium/593b4b7bdb3d3d3dea053eb2c2406440.jpg" style="margin: 0; width: 100%;" alt="" />
<p style="font-size: 12px; margin: 0;">PikWizard</p>
</a>
</span>
</span>
Free (free of charge)
Free for personal and commercial use.
Author: Awesome Content
Similar Free Stock Images

Premium


Premium


Premium


Premium


Premium


Premium


Premium


Premium


Premium


Premium


Premium


Premium


Premium


Premium


Premium


Premium


Premium


Premium


Premium


Premium


Premium


Premium


Premium


Premium

