- Home >
- Stock Photos >
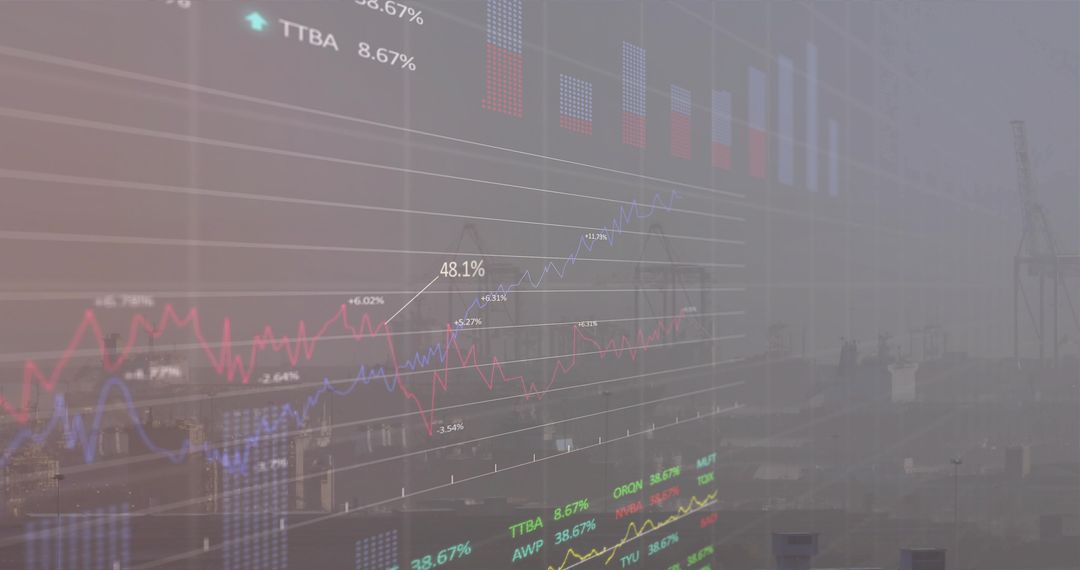
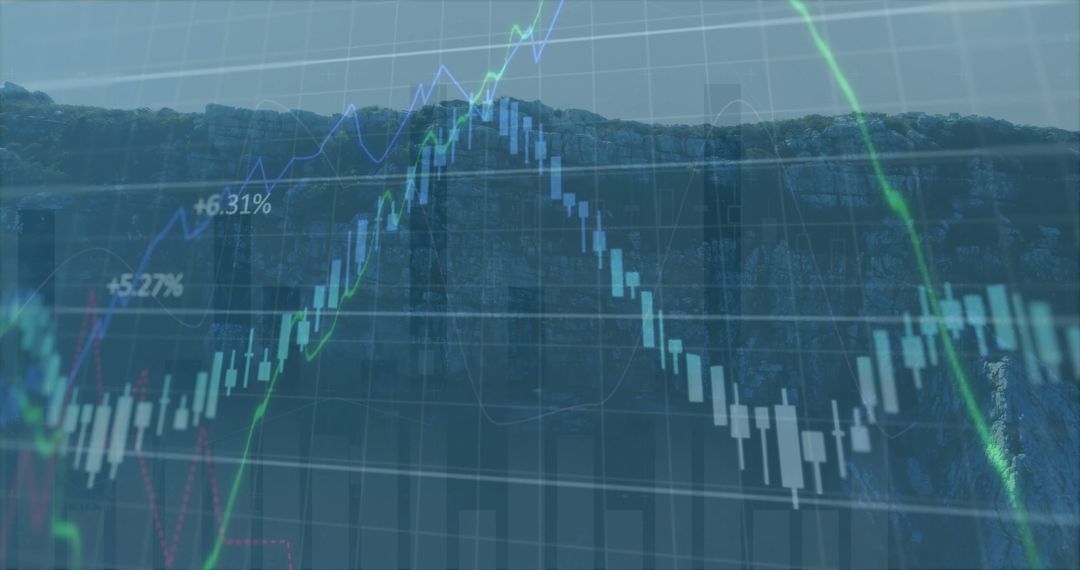
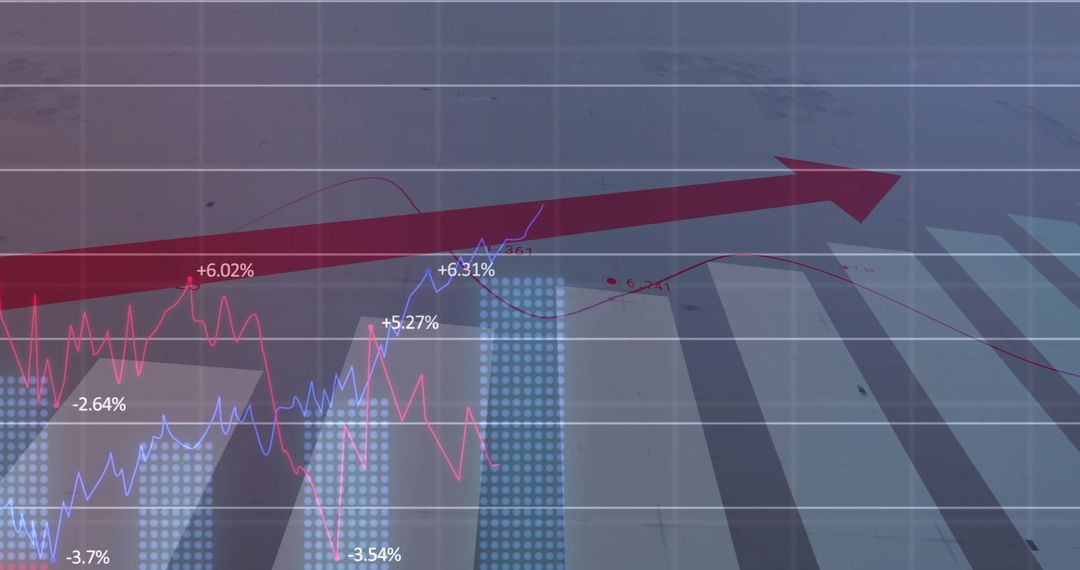
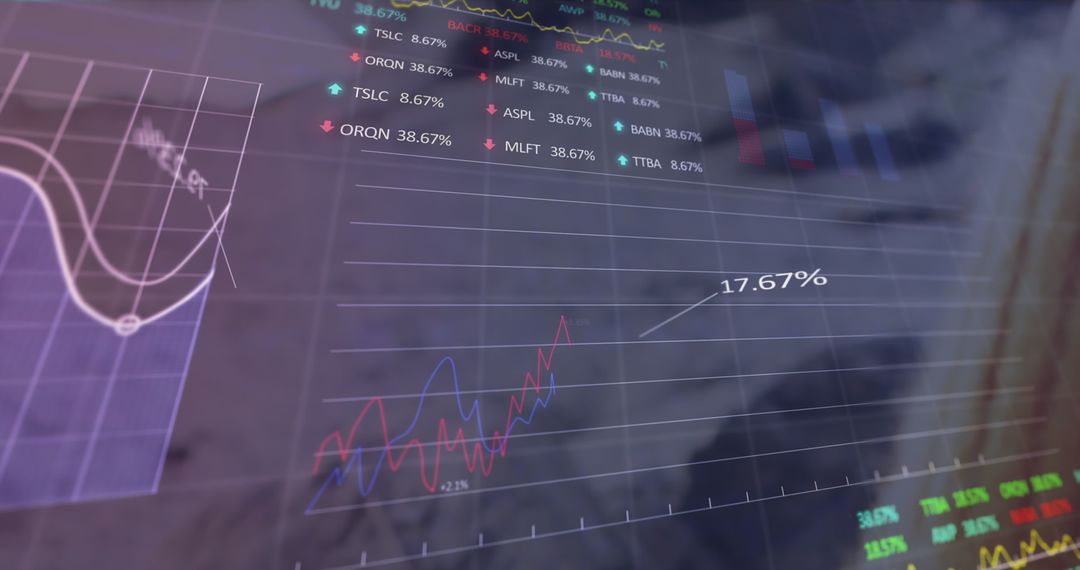
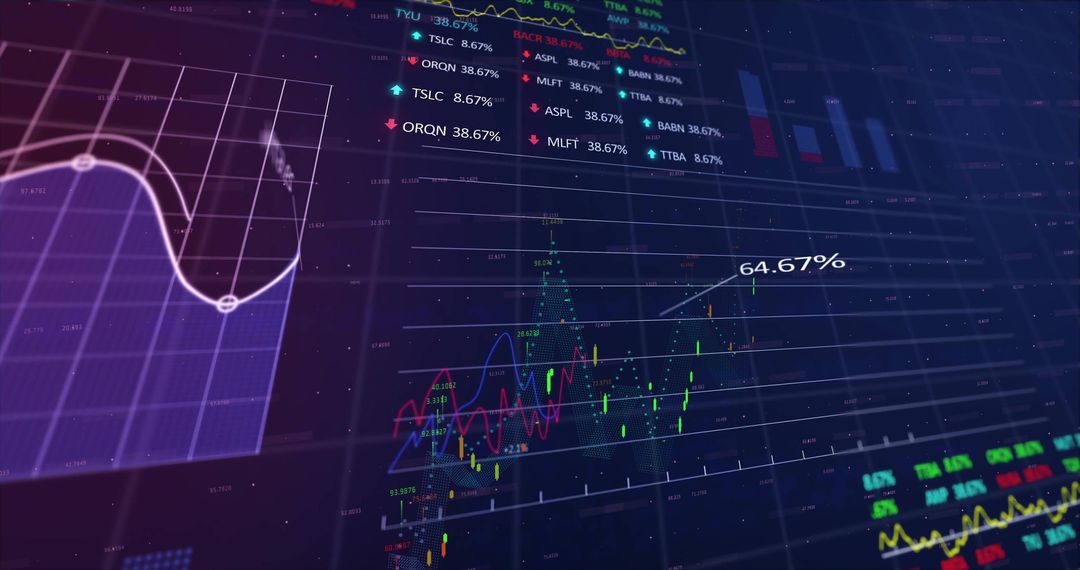
- Dynamic Financial Charts Displaying Corporate Trends and Data
Dynamic Financial Charts Displaying Corporate Trends and Data Image

Displays a dynamic scene with analytical aspects highlighting red and blue trend lines measuring performance. Useful for illustrating concepts in financial presentations, giving visual life to finance or investment themed projects, and explaining market analysis patterns. Ideal for corporate contexts, educational purposes or conveying statistics-driven insights.
Powered by 


0
downloads
downloads
Tags:
More
Credit Photo
If you would like to credit the Photo, here are some ways you can do so
Text Link
photo Link
<span class="text-link">
<span>
<a target="_blank" href=https://pikwizard.com/photo/dynamic-financial-charts-displaying-corporate-trends-and-data/76ac4b75e59d34981f86f64d71228dc1/>PikWizard</a>
</span>
</span>
<span class="image-link">
<span
style="margin: 0 0 20px 0; display: inline-block; vertical-align: middle; width: 100%;"
>
<a
target="_blank"
href="https://pikwizard.com/photo/dynamic-financial-charts-displaying-corporate-trends-and-data/76ac4b75e59d34981f86f64d71228dc1/"
style="text-decoration: none; font-size: 10px; margin: 0;"
>
<img src="https://pikwizard.com/pw/medium/76ac4b75e59d34981f86f64d71228dc1.jpg" style="margin: 0; width: 100%;" alt="" />
<p style="font-size: 12px; margin: 0;">PikWizard</p>
</a>
</span>
</span>
Free (free of charge)
Free for personal and commercial use.
Author: Creative Art
Similar Free Stock Images

Premium


Premium


Premium


Premium


Premium


Premium


Premium


Premium


Premium


Premium


Premium


Premium


Premium


Premium


Premium


Premium


Premium


Premium


Premium


Premium


Premium


Premium


Premium


Premium