- Home >
- Stock Photos >
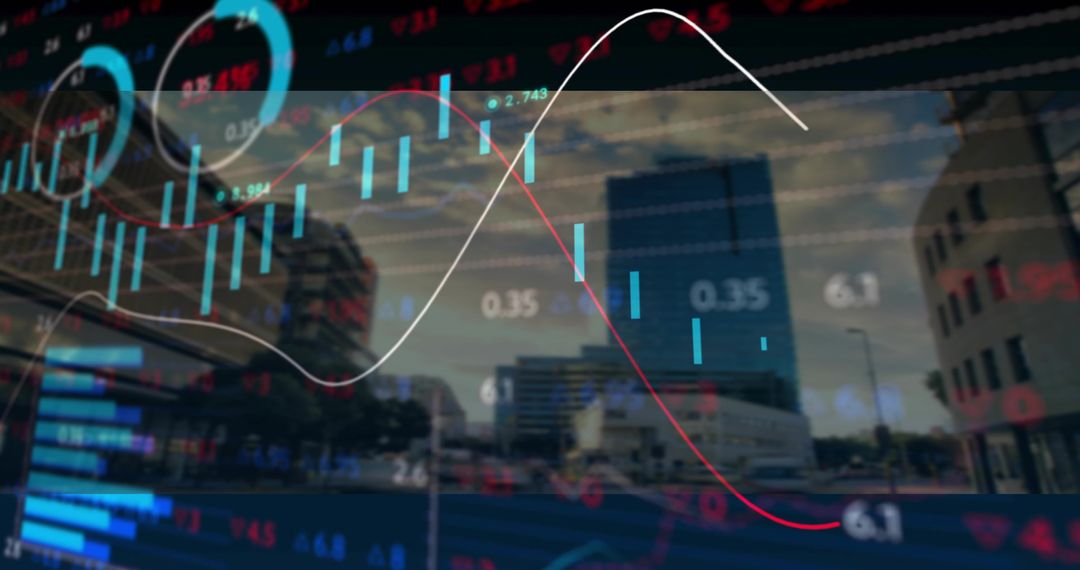
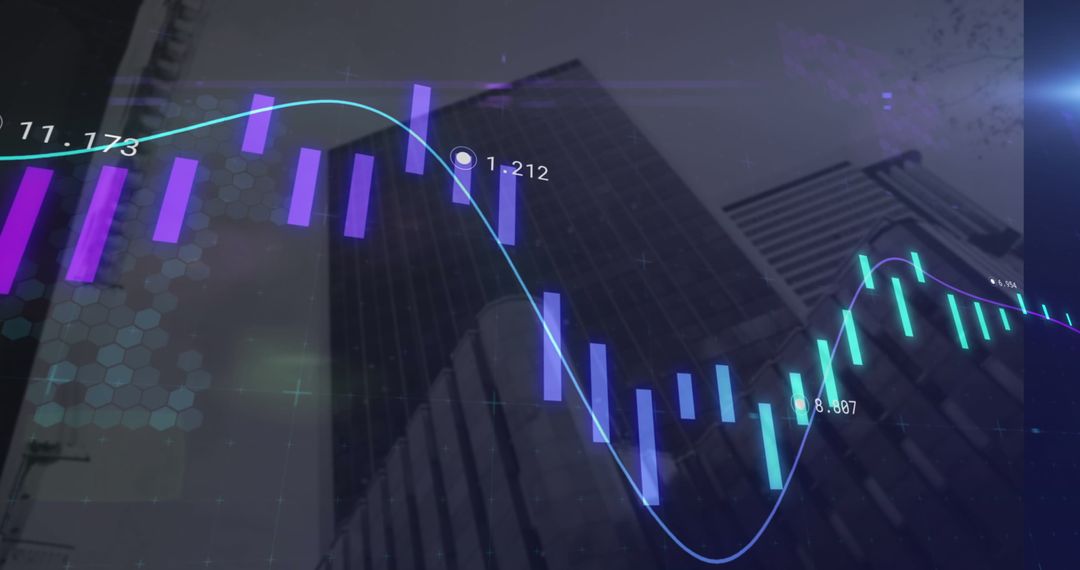
- Dynamic Financial Charts Overlaying Urban Skyline for Analytical Insights
Dynamic Financial Charts Overlaying Urban Skyline for Analytical Insights Image
Modern technology and urban environments form a complex harmony, making it suitable for financial presentations, forecasting reports, or urban planning insights. Ideal for use in articles about the fusion of governance and cutting-edge financial solutions. Especially useful when illustrating futurist perspectives on business and technology integration.
Powered by  - Get 15% off with code: PIKWIZARD15


0
downloads
downloads
Tags:
More
Credit Photo
If you would like to credit the Photo, here are some ways you can do so
Text Link
photo Link
<span class="text-link">
<span>
<a target="_blank" href=https://pikwizard.com/photo/dynamic-financial-charts-overlaying-urban-skyline-for-analytical-insights/f4fb48269dec90efcb9064dd349bf74a/>PikWizard</a>
</span>
</span>
<span class="image-link">
<span
style="margin: 0 0 20px 0; display: inline-block; vertical-align: middle; width: 100%;"
>
<a
target="_blank"
href="https://pikwizard.com/photo/dynamic-financial-charts-overlaying-urban-skyline-for-analytical-insights/f4fb48269dec90efcb9064dd349bf74a/"
style="text-decoration: none; font-size: 10px; margin: 0;"
>
<img src="https://pikwizard.com/pw/medium/f4fb48269dec90efcb9064dd349bf74a.jpg" style="margin: 0; width: 100%;" alt="" />
<p style="font-size: 12px; margin: 0;">PikWizard</p>
</a>
</span>
</span>
Free (free of charge)
Free for personal and commercial use.
Author: Creative Art
Similar Free Stock Images

Premium


Premium


Premium


Premium


Premium


Premium


Premium


Premium


Premium


Premium


Premium


Premium


Premium


Premium


Premium


Premium


Premium


Premium


Premium


Premium


Premium


Premium


Premium


Premium