- Home >
- Stock Photos >
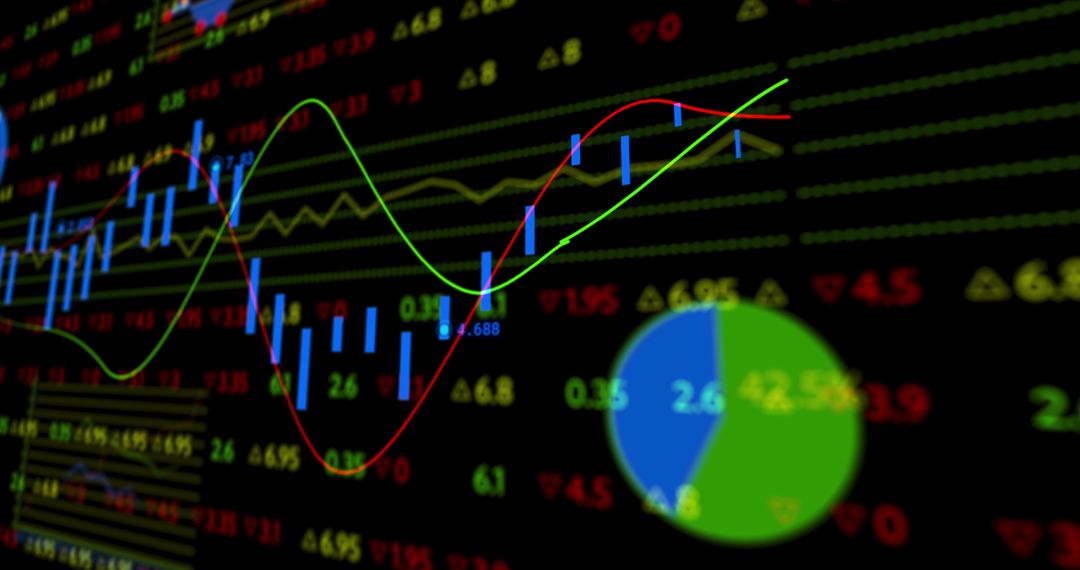
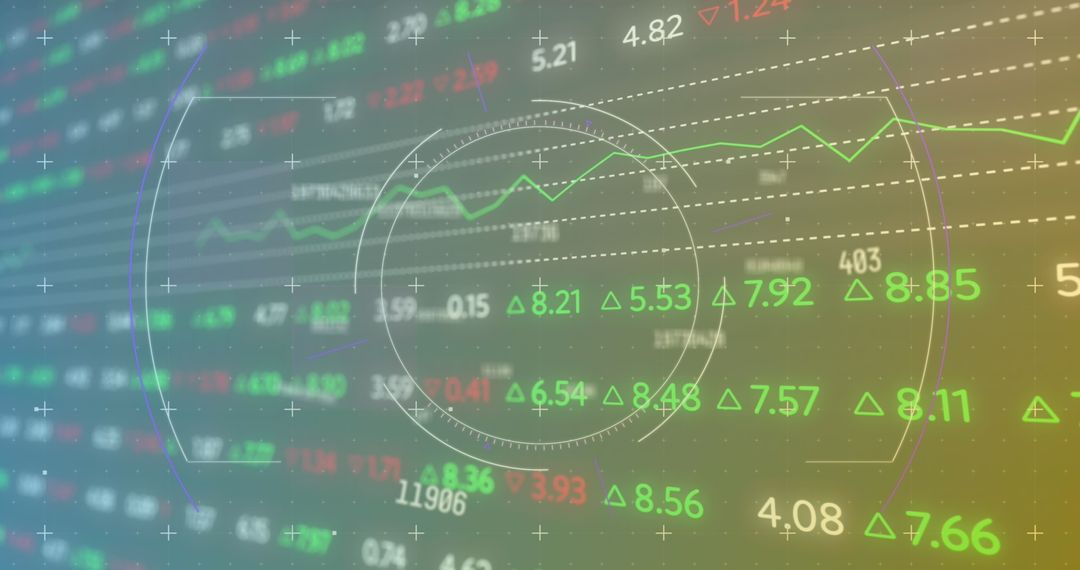
- Dynamic Financial Charts with Colorful Data Visualization
Dynamic Financial Charts with Colorful Data Visualization Image

Vibrant chart with various indicators, ideal for conveying themes of finance, business, or data analytics. Suitable for use in presentations, financial reports, or as informative visuals within economic-related articles.
Powered by  - Get 15% off with code: PIKWIZARD15


2
downloads
downloads
Tags:
More
Credit Photo
If you would like to credit the Photo, here are some ways you can do so
Text Link
photo Link
<span class="text-link">
<span>
<a target="_blank" href=https://pikwizard.com/photo/dynamic-financial-charts-with-colorful-data-visualization/e4a218d06b2835c61f0ab2842a5929d4/>PikWizard</a>
</span>
</span>
<span class="image-link">
<span
style="margin: 0 0 20px 0; display: inline-block; vertical-align: middle; width: 100%;"
>
<a
target="_blank"
href="https://pikwizard.com/photo/dynamic-financial-charts-with-colorful-data-visualization/e4a218d06b2835c61f0ab2842a5929d4/"
style="text-decoration: none; font-size: 10px; margin: 0;"
>
<img src="https://pikwizard.com/pw/medium/e4a218d06b2835c61f0ab2842a5929d4.jpg" style="margin: 0; width: 100%;" alt="" />
<p style="font-size: 12px; margin: 0;">PikWizard</p>
</a>
</span>
</span>
Free (free of charge)
Free for personal and commercial use.
Author: Authentic Images
Similar Free Stock Images
Premium


Premium


Premium


Premium


Premium


Premium


Premium


Premium


Premium


Premium


Premium


Premium


Premium


Premium


Premium


Premium


Premium


Premium


Premium


Premium


Premium


Premium


Premium


Premium