- Home >
- Stock Photos >
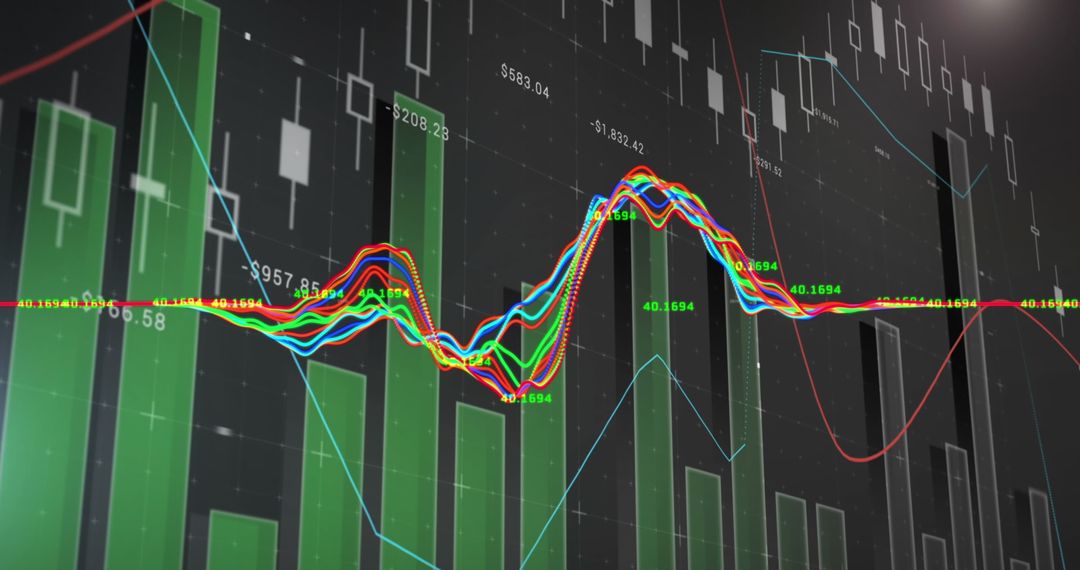
- Dynamic Financial Dashboard Depicting Business Analytics
Dynamic Financial Dashboard Depicting Business Analytics Image

This image showcases a vibrant financial dashboard displaying various colored line graphs and 3D bar charts. It depicts real-time analytics, ideal for presentations about business intelligence, data-driven strategies, and corporate decision-making. Suitable for illustrating concepts in data analysis, predicting trends, and visual storytelling in finance.
Powered by  - Get 15% off with code: PIKWIZARD15


0
downloads
downloads
Tags:
More
Credit Photo
If you would like to credit the Photo, here are some ways you can do so
Text Link
photo Link
<span class="text-link">
<span>
<a target="_blank" href=https://pikwizard.com/photo/dynamic-financial-dashboard-depicting-business-analytics/dd1492be52ee9932c917f99b1615a364/>PikWizard</a>
</span>
</span>
<span class="image-link">
<span
style="margin: 0 0 20px 0; display: inline-block; vertical-align: middle; width: 100%;"
>
<a
target="_blank"
href="https://pikwizard.com/photo/dynamic-financial-dashboard-depicting-business-analytics/dd1492be52ee9932c917f99b1615a364/"
style="text-decoration: none; font-size: 10px; margin: 0;"
>
<img src="https://pikwizard.com/pw/medium/dd1492be52ee9932c917f99b1615a364.jpg" style="margin: 0; width: 100%;" alt="" />
<p style="font-size: 12px; margin: 0;">PikWizard</p>
</a>
</span>
</span>
Free (free of charge)
Free for personal and commercial use.
Author: Creative Art
Similar Free Stock Images

Premium


Premium


Premium


Premium


Premium


Premium


Premium


Premium


Premium


Premium


Premium


Premium


Premium


Premium


Premium


Premium


Premium


Premium


Premium


Premium


Premium


Premium


Premium


Premium