- Home >
- Stock Photos >
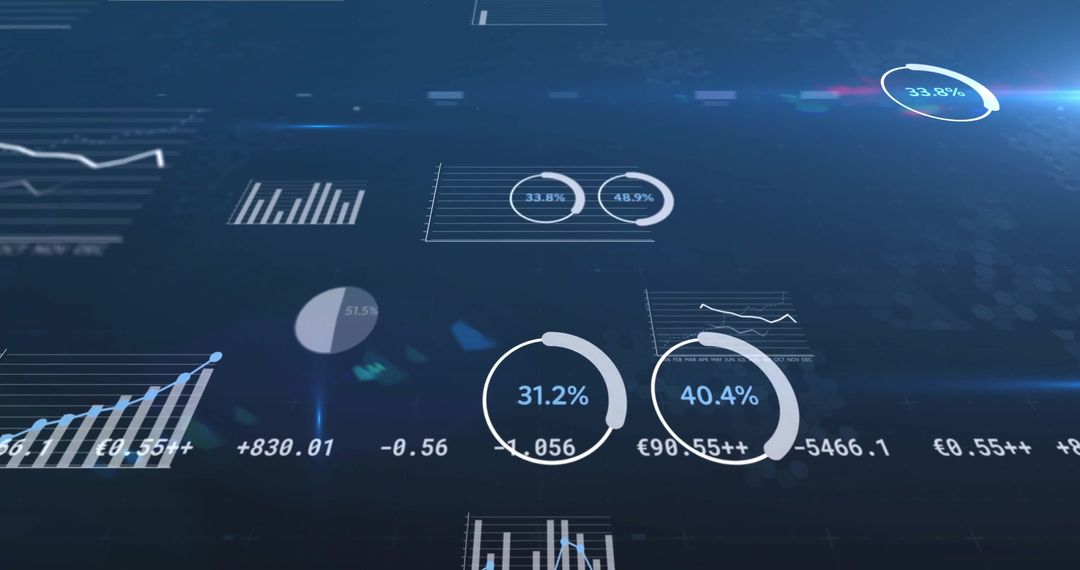
- Dynamic Financial Dashboard Overlay Illustrating Growth Trends
Dynamic Financial Dashboard Overlay Illustrating Growth Trends Image

Visual representation of a financial dashboard with digital data and interactive graphs conveying growth trends. Suitable for use in presentations, financial reports, and marketing materials related to finance, business strategy, or technological integration in data analytics.
Powered by  - Get 15% off with code: PIKWIZARD15


0
downloads
downloads
Tags:
More
Credit Photo
If you would like to credit the Photo, here are some ways you can do so
Text Link
photo Link
<span class="text-link">
<span>
<a target="_blank" href=https://pikwizard.com/photo/dynamic-financial-dashboard-overlay-illustrating-growth-trends/f7e3aea445e5687ddc6e1a65a76d4759/>PikWizard</a>
</span>
</span>
<span class="image-link">
<span
style="margin: 0 0 20px 0; display: inline-block; vertical-align: middle; width: 100%;"
>
<a
target="_blank"
href="https://pikwizard.com/photo/dynamic-financial-dashboard-overlay-illustrating-growth-trends/f7e3aea445e5687ddc6e1a65a76d4759/"
style="text-decoration: none; font-size: 10px; margin: 0;"
>
<img src="https://pikwizard.com/pw/medium/f7e3aea445e5687ddc6e1a65a76d4759.jpg" style="margin: 0; width: 100%;" alt="" />
<p style="font-size: 12px; margin: 0;">PikWizard</p>
</a>
</span>
</span>
Free (free of charge)
Free for personal and commercial use.
Author: Awesome Content
Similar Free Stock Images

Premium


Premium


Premium


Premium


Premium


Premium


Premium


Premium


Premium


Premium


Premium


Premium


Premium


Premium


Premium


Premium


Premium


Premium


Premium


Premium


Premium


Premium


Premium


Premium