- Home >
- Stock Photos >
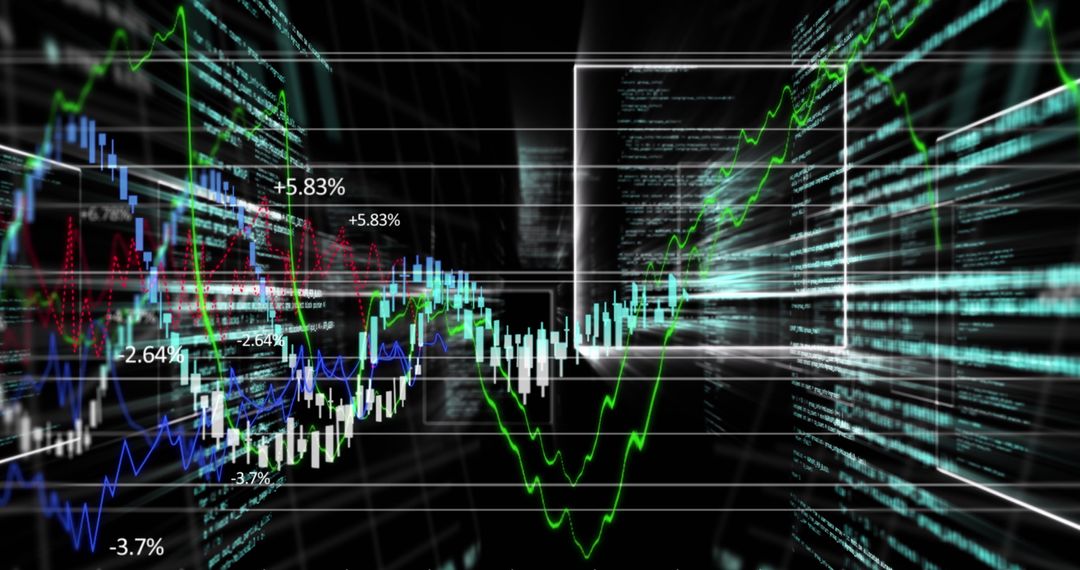
- Dynamic Financial Dashboard with 3D Bar and Line Graphs
Dynamic Financial Dashboard with 3D Bar and Line Graphs Image
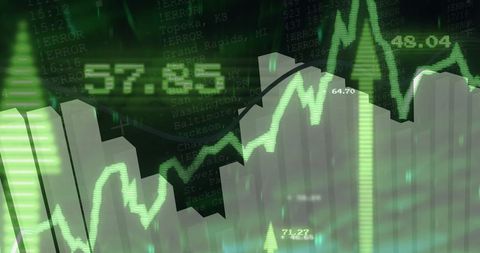
This image provides a dynamic view of financial data with rising 3D bars and a vibrant line graph. The background of city names and numbers illustrates economic or error metrics, adding layers of analytical detail. Perfect for use in finance-related blog posts, digital presentations on data science, or as contextual imagery on investment platforms or economic development reports.
Powered by 


0
downloads
downloads
Tags:
More
Credit Photo
If you would like to credit the Photo, here are some ways you can do so
Text Link
photo Link
<span class="text-link">
<span>
<a target="_blank" href=https://pikwizard.com/photo/dynamic-financial-dashboard-with-3d-bar-and-line-graphs/52bd66e34f2a4ea4c5e198ca2b644825/>PikWizard</a>
</span>
</span>
<span class="image-link">
<span
style="margin: 0 0 20px 0; display: inline-block; vertical-align: middle; width: 100%;"
>
<a
target="_blank"
href="https://pikwizard.com/photo/dynamic-financial-dashboard-with-3d-bar-and-line-graphs/52bd66e34f2a4ea4c5e198ca2b644825/"
style="text-decoration: none; font-size: 10px; margin: 0;"
>
<img src="https://pikwizard.com/pw/medium/52bd66e34f2a4ea4c5e198ca2b644825.jpg" style="margin: 0; width: 100%;" alt="" />
<p style="font-size: 12px; margin: 0;">PikWizard</p>
</a>
</span>
</span>
Free (free of charge)
Free for personal and commercial use.
Author: Authentic Images
Similar Free Stock Images

Premium


Premium


Premium


Premium


Premium


Premium


Premium


Premium


Premium


Premium


Premium


Premium


Premium


Premium


Premium


Premium


Premium


Premium


Premium


Premium


Premium


Premium


Premium


Premium