
- Home >
- Stock Photos >
- Dynamic Financial Dashboard with Rising Chart and Analytics
Dynamic Financial Dashboard with Rising Chart and Analytics Image

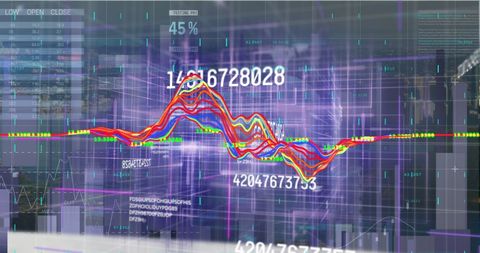
Visual represents a digital finance dashboard featuring a rising line graph with a 17.81% increase. Suited for financial analysis and business performance discussions. Useful for presentations on investment strategies, technological advancements in financial data, and highlighting the latest market trends.
Powered by 


downloads
Tags:
More
Credit Photo
If you would like to credit the Photo, here are some ways you can do so
Text Link
photo Link
<span class="text-link">
<span>
<a target="_blank" href=https://pikwizard.com/photo/dynamic-financial-dashboard-with-rising-chart-and-analytics/20429cd71525ec3ebd3d8fa3bb48bf6d/>PikWizard</a>
</span>
</span>
<span class="image-link">
<span
style="margin: 0 0 20px 0; display: inline-block; vertical-align: middle; width: 100%;"
>
<a
target="_blank"
href="https://pikwizard.com/photo/dynamic-financial-dashboard-with-rising-chart-and-analytics/20429cd71525ec3ebd3d8fa3bb48bf6d/"
style="text-decoration: none; font-size: 10px; margin: 0;"
>
<img src="https://pikwizard.com/pw/medium/20429cd71525ec3ebd3d8fa3bb48bf6d.jpg" style="margin: 0; width: 100%;" alt="" />
<p style="font-size: 12px; margin: 0;">PikWizard</p>
</a>
</span>
</span>
Free (free of charge)
Free for personal and commercial use.
Author: Awesome Content
Similar Free Stock Images

Premium


Premium

Premium


Premium


Premium


Premium


Premium


Premium


Premium


Premium

Premium

Premium


Premium


Premium

Premium


Premium


Premium


Premium

Premium


Premium


Premium


Premium


Premium


Premium


Premium


Explore More Free Stock Images