- Home >
- Stock Photos >
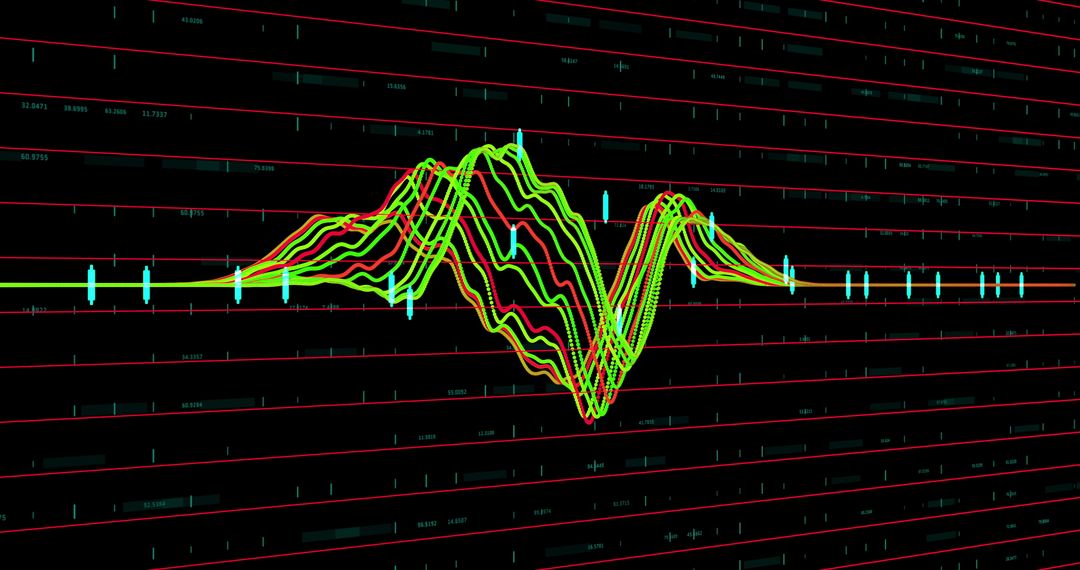
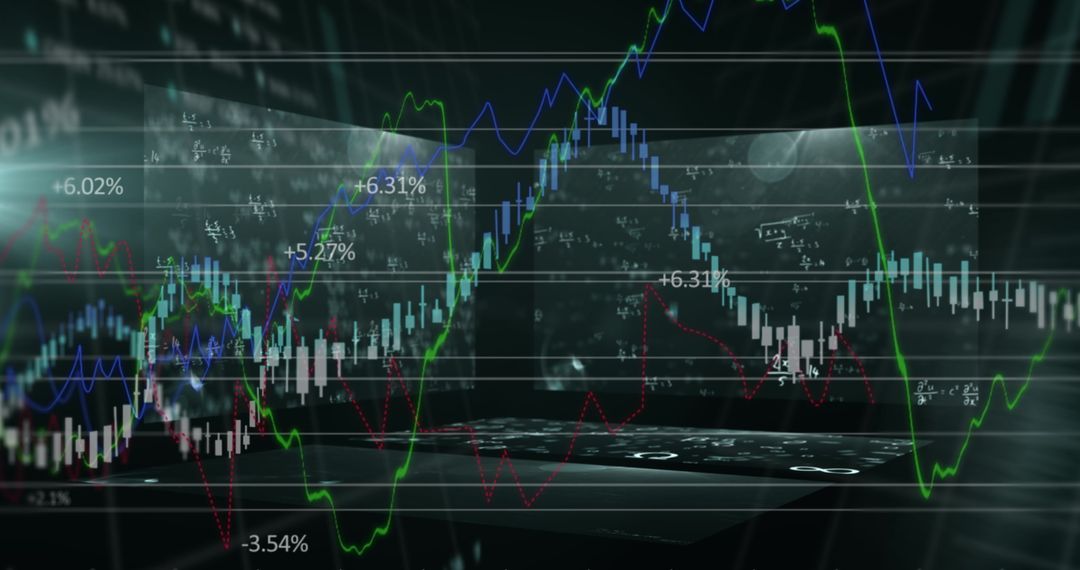
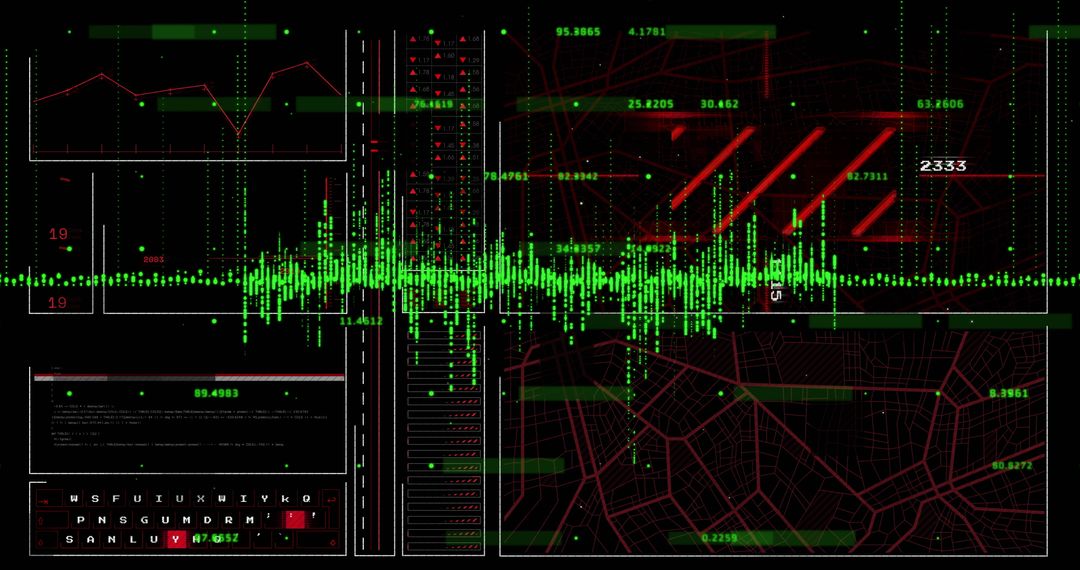
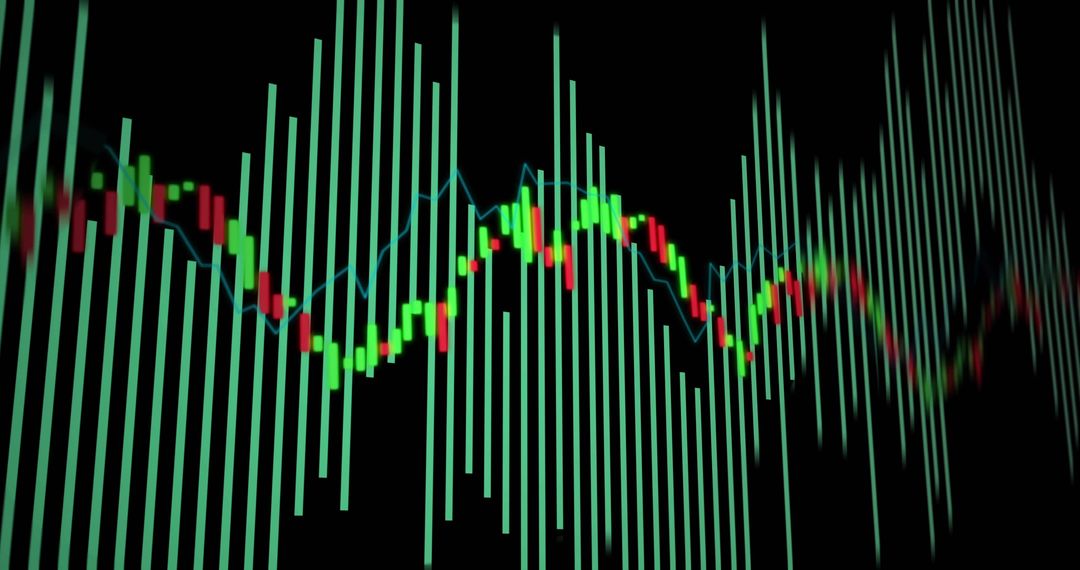
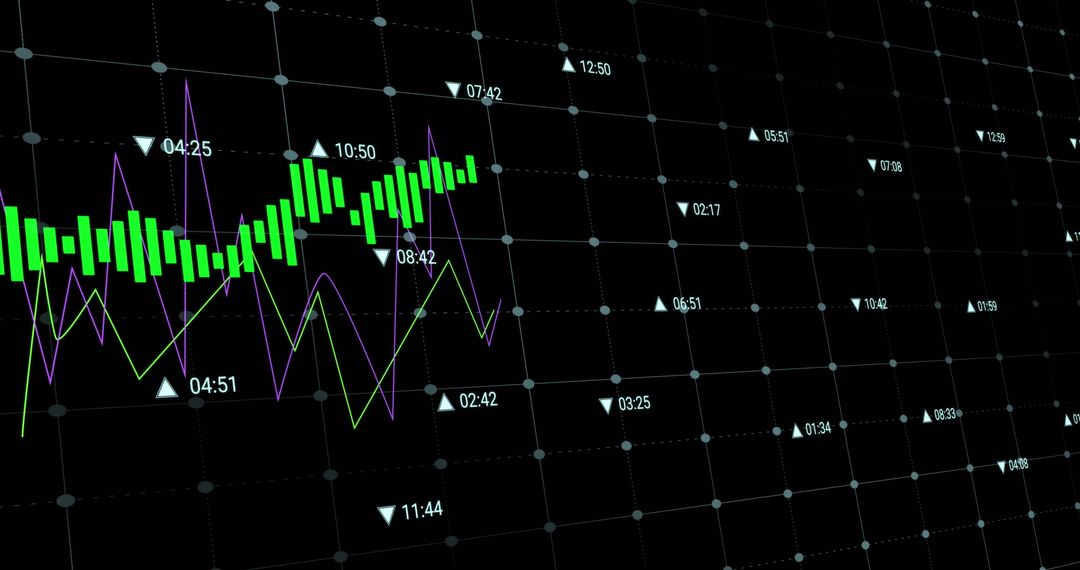
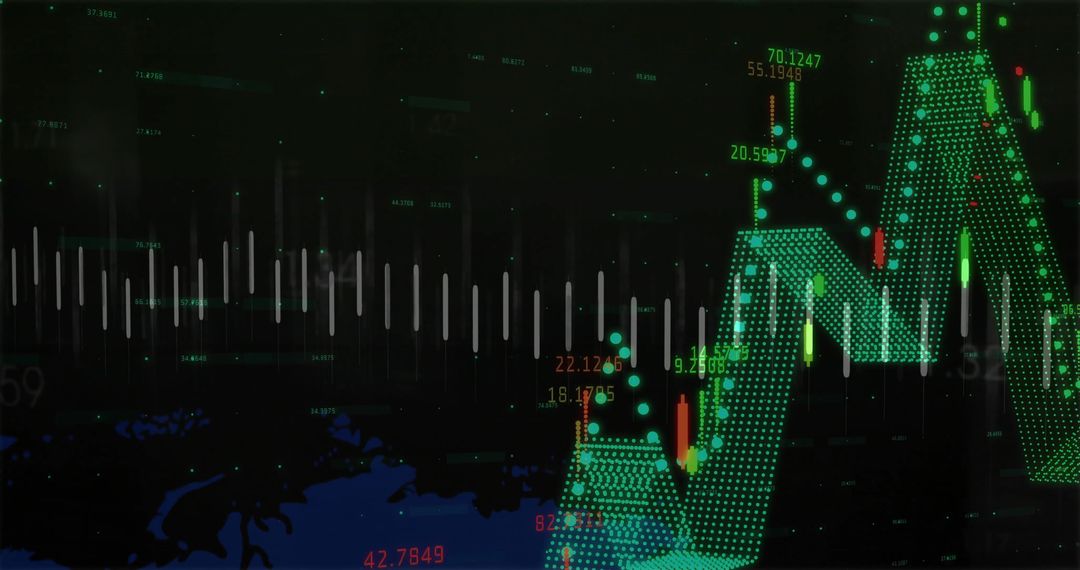
- Dynamic Financial Dashboard with Stock Market Analytics Display
Dynamic Financial Dashboard with Stock Market Analytics Display Image
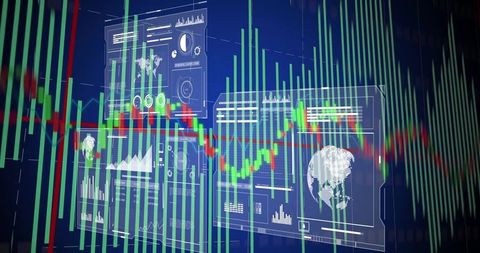
This visual showcases a sophisticated financial dashboard composed of candlestick bars, a line graph, and a world map, suitable for illustrating advanced trading user interfaces. It is ideal for use in publications related to digital finance, showcasing software interfaces in investments or technology visuals illustrating the dynamic nature of the global stock market. This can be particularly useful in articles, presentations, and educational materials focused on economics or investment strategies.
Powered by  - Get 15% off with code: PIKWIZARD15


2
downloads
downloads
Tags:
More
Credit Photo
If you would like to credit the Photo, here are some ways you can do so
Text Link
photo Link
<span class="text-link">
<span>
<a target="_blank" href=https://pikwizard.com/photo/dynamic-financial-dashboard-with-stock-market-analytics-display/89995f0ebd609720a93e7184ce5f720e/>PikWizard</a>
</span>
</span>
<span class="image-link">
<span
style="margin: 0 0 20px 0; display: inline-block; vertical-align: middle; width: 100%;"
>
<a
target="_blank"
href="https://pikwizard.com/photo/dynamic-financial-dashboard-with-stock-market-analytics-display/89995f0ebd609720a93e7184ce5f720e/"
style="text-decoration: none; font-size: 10px; margin: 0;"
>
<img src="https://pikwizard.com/pw/medium/89995f0ebd609720a93e7184ce5f720e.jpg" style="margin: 0; width: 100%;" alt="" />
<p style="font-size: 12px; margin: 0;">PikWizard</p>
</a>
</span>
</span>
Free (free of charge)
Free for personal and commercial use.
Author: People Creations