- Home >
- Stock Photos >
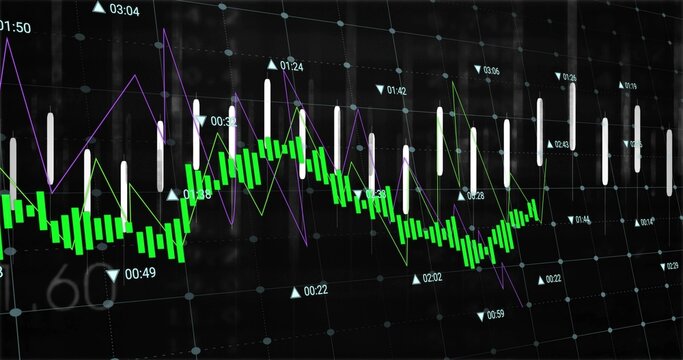
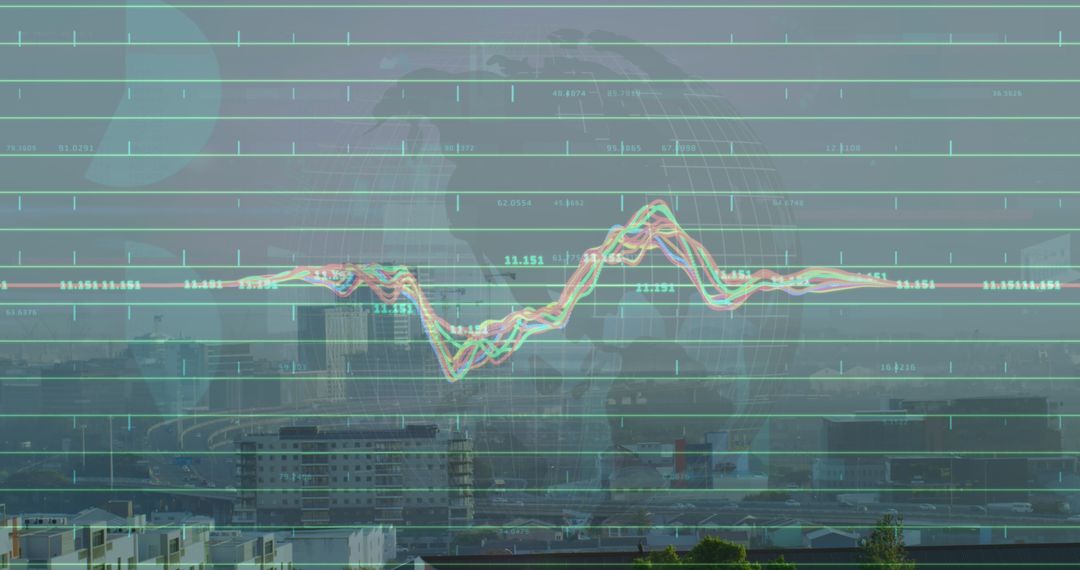
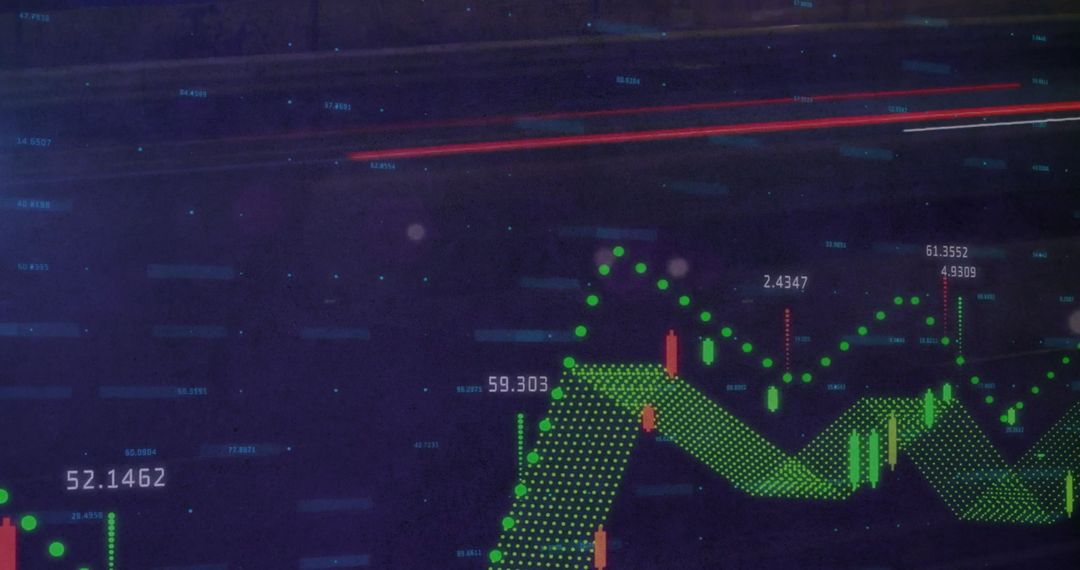
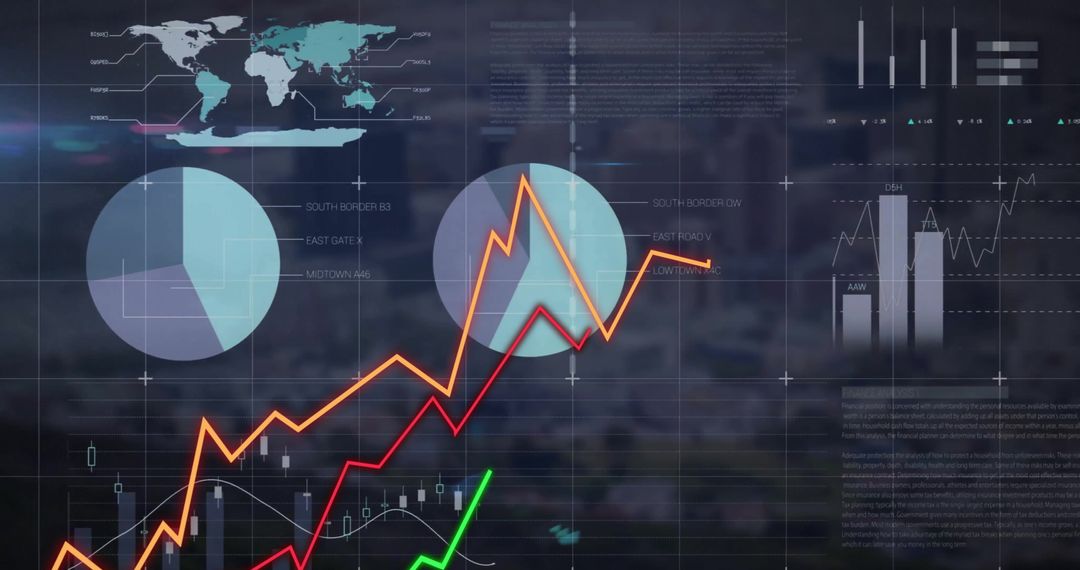
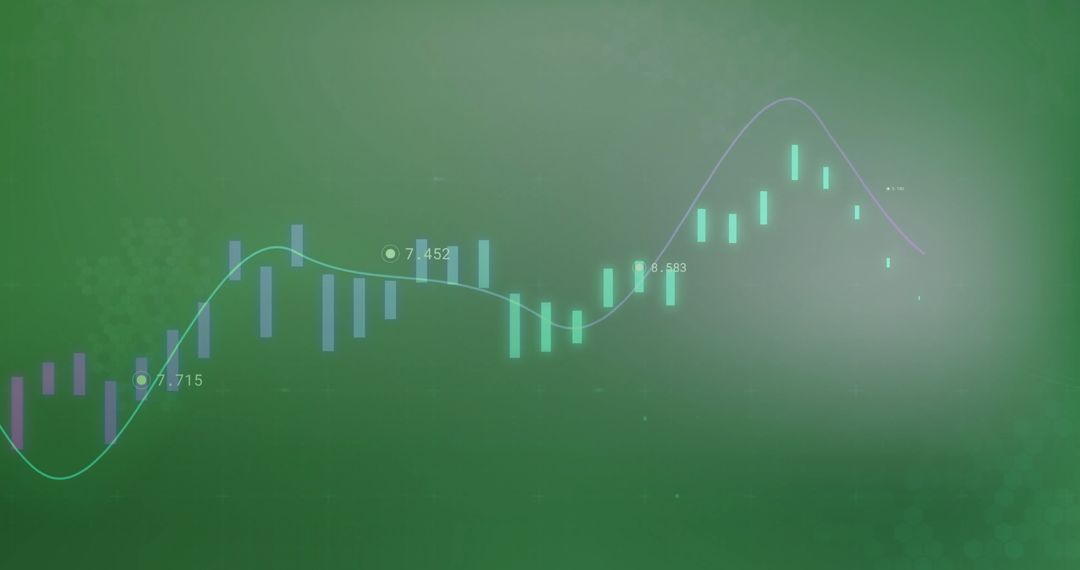
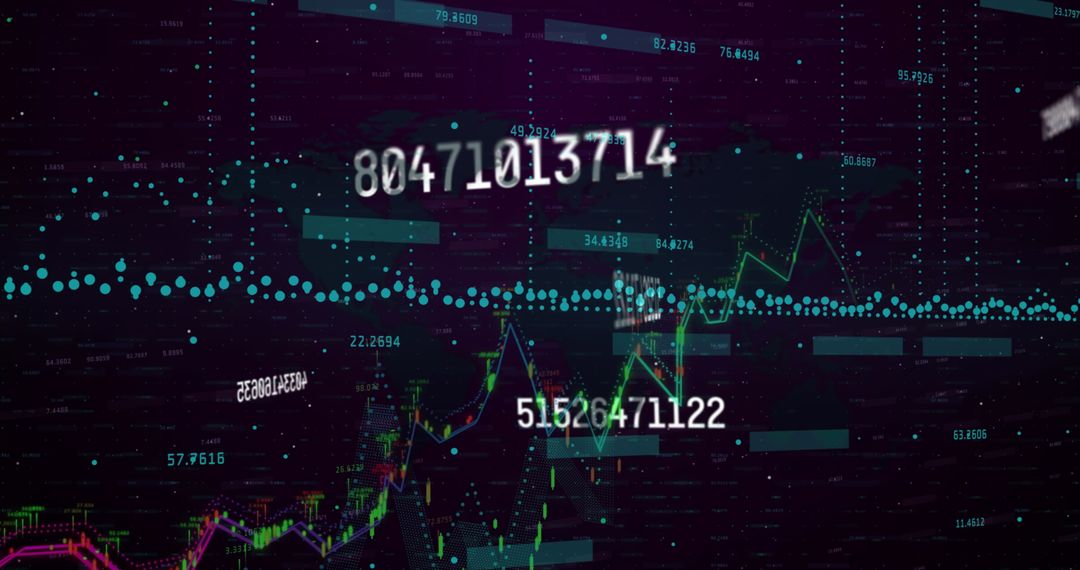
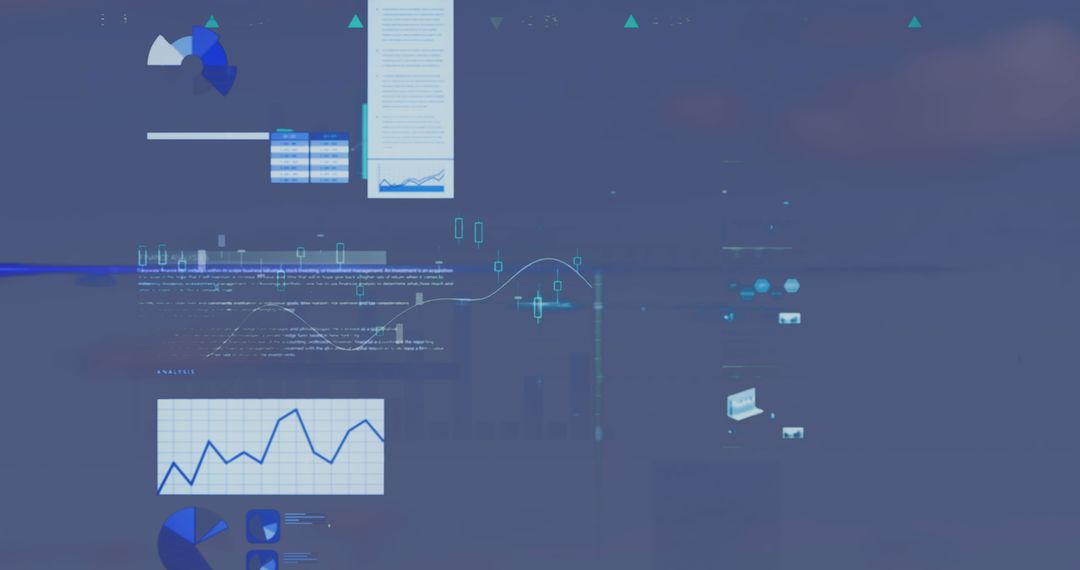
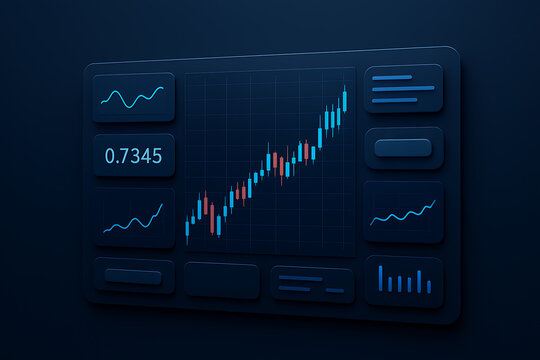
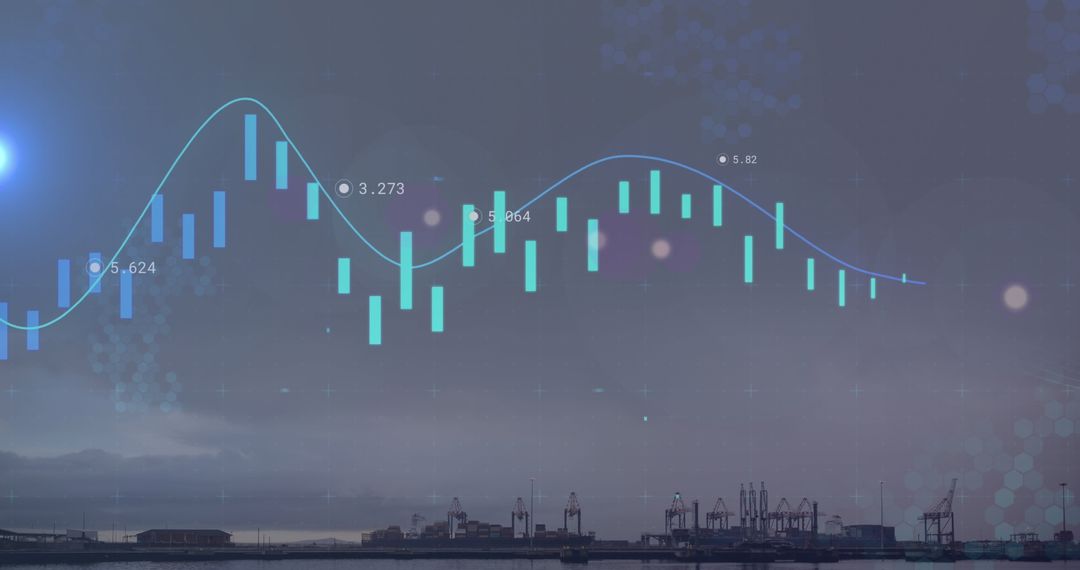
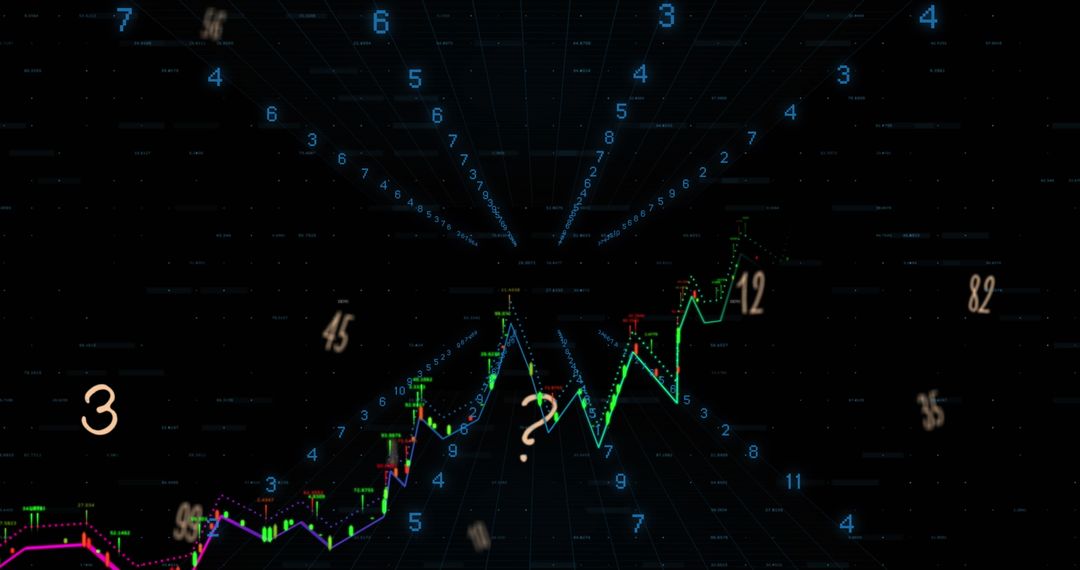
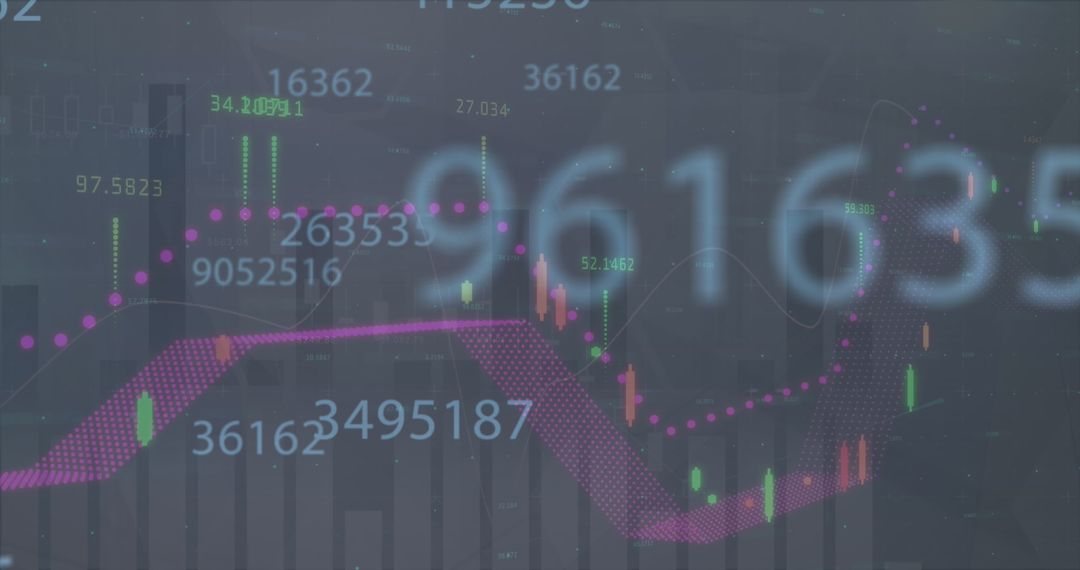
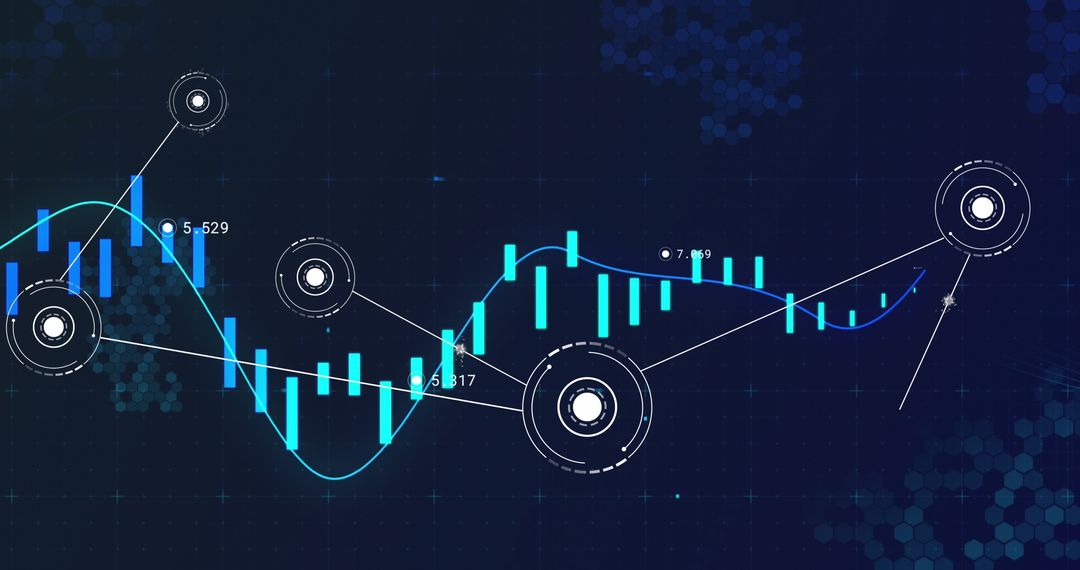
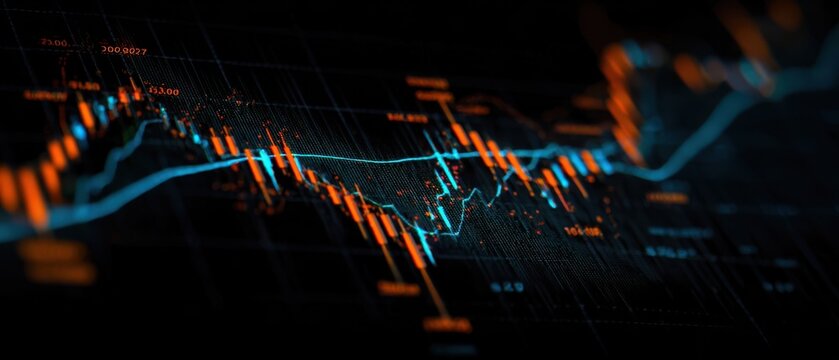
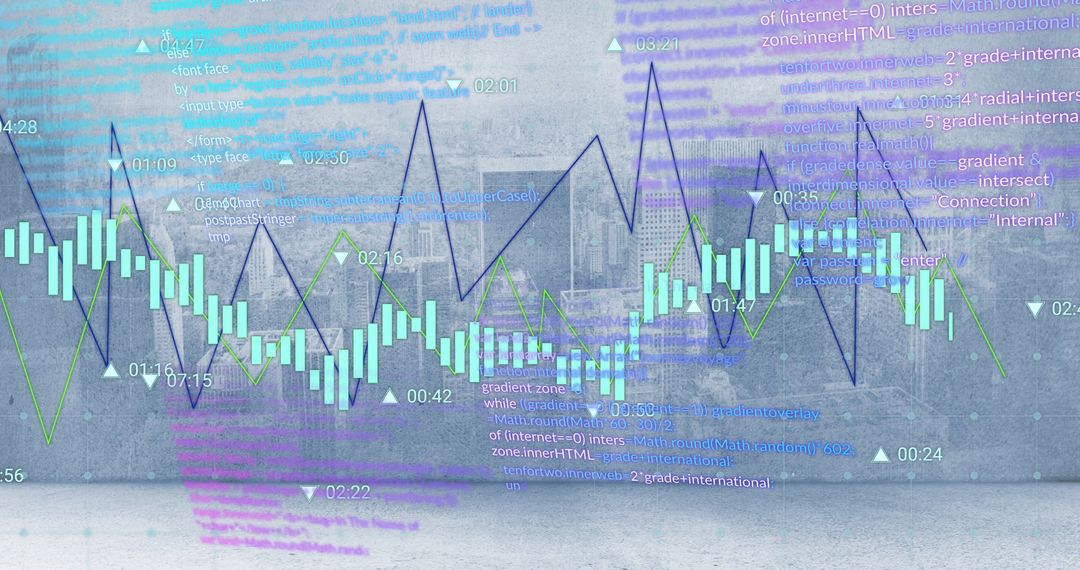
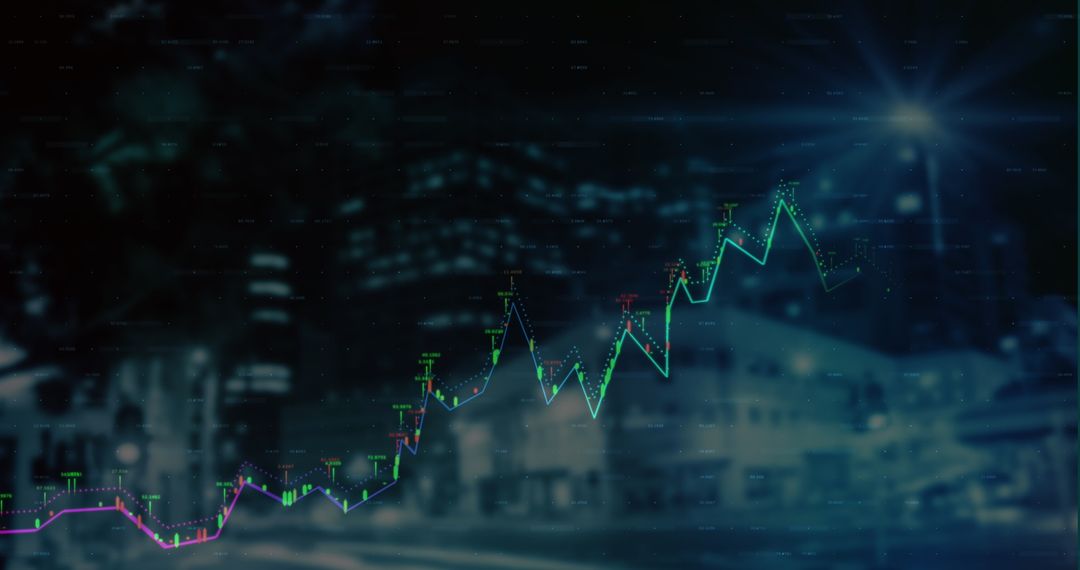
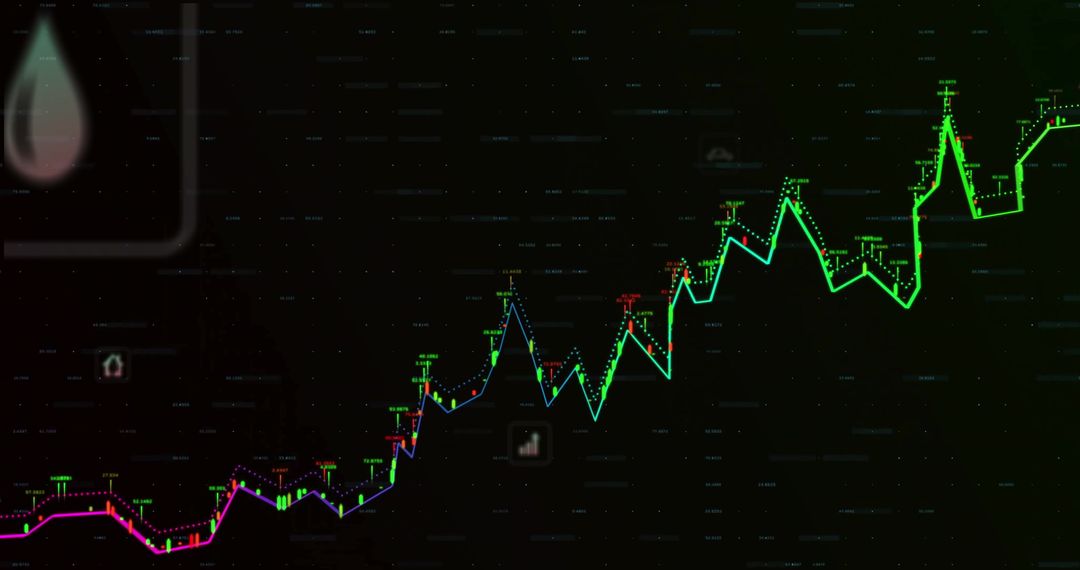
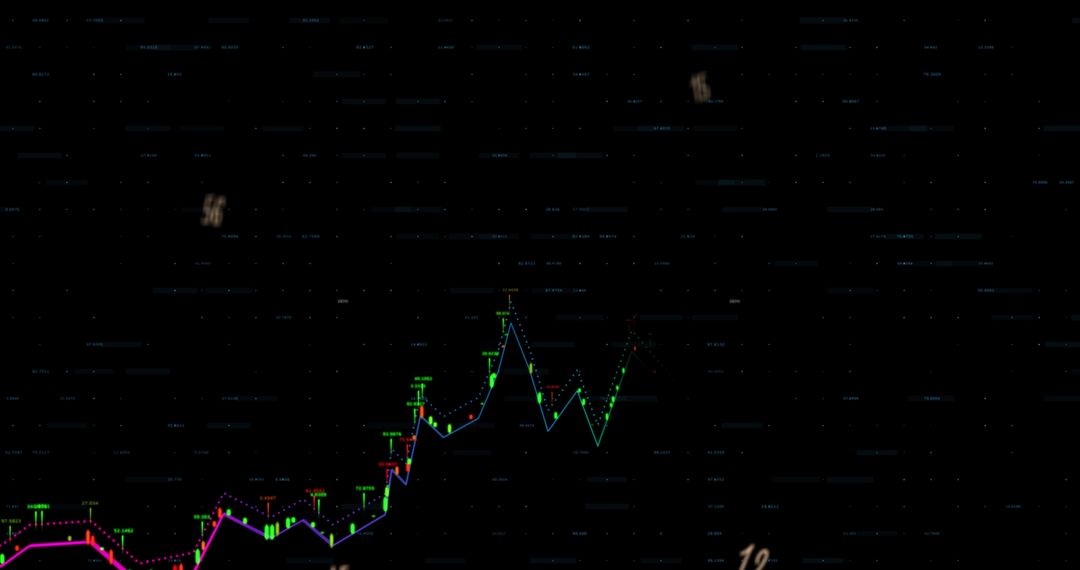
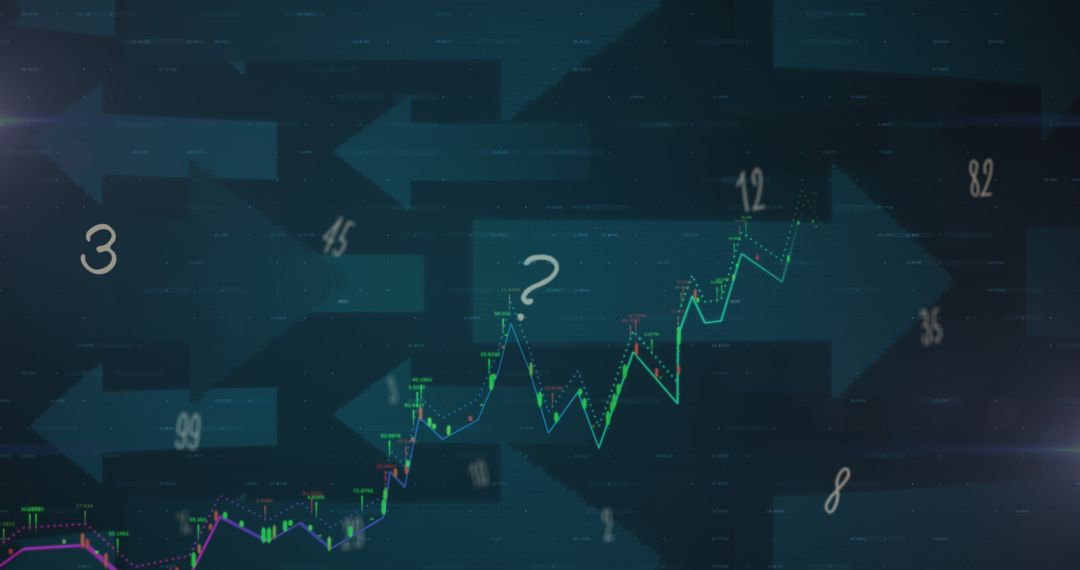
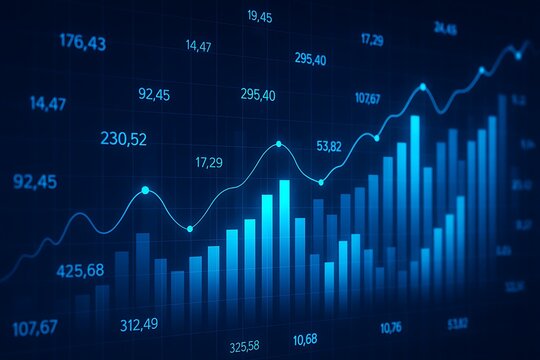
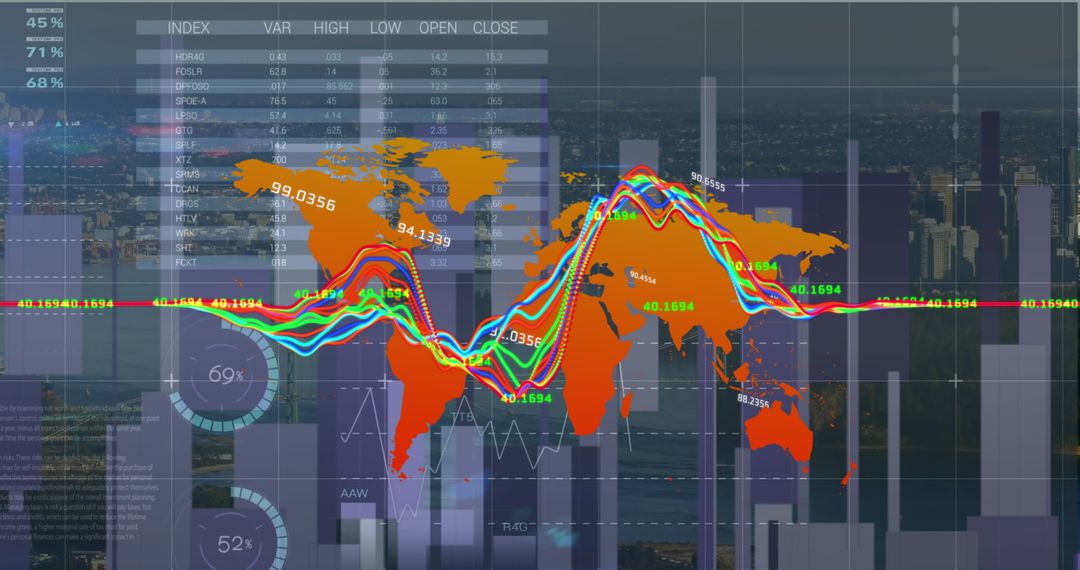
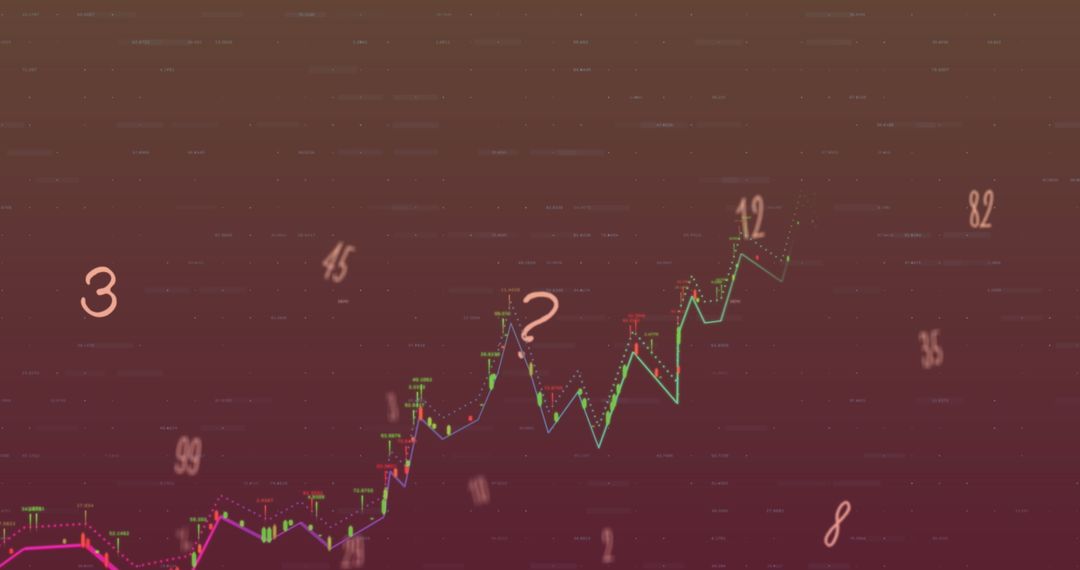
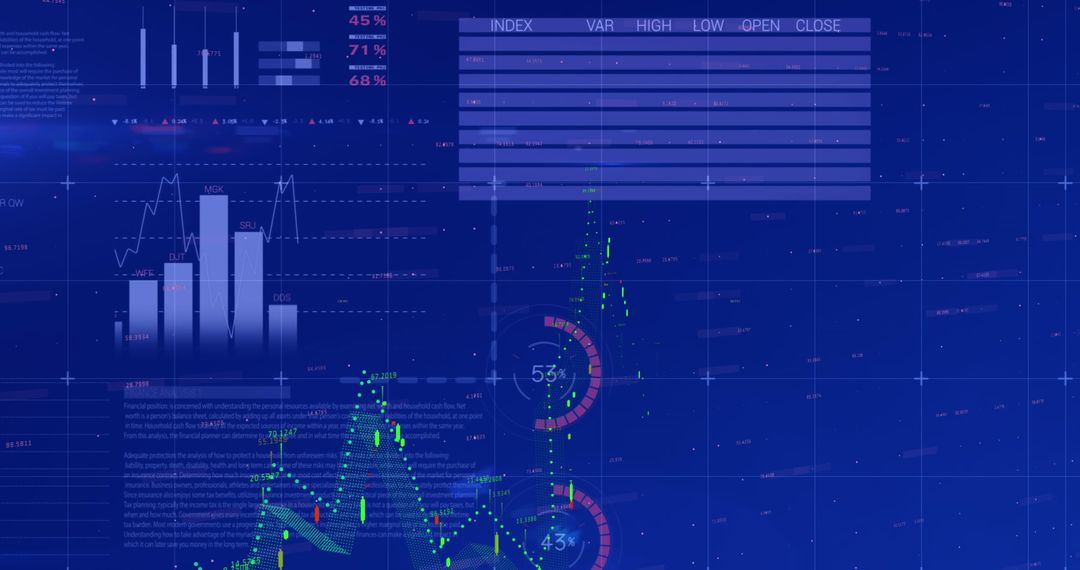
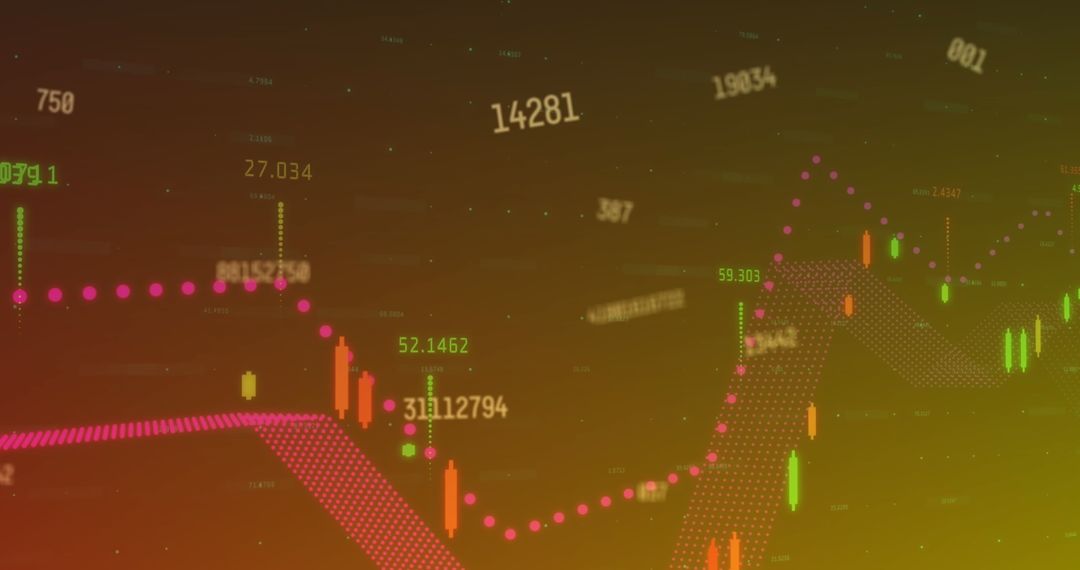
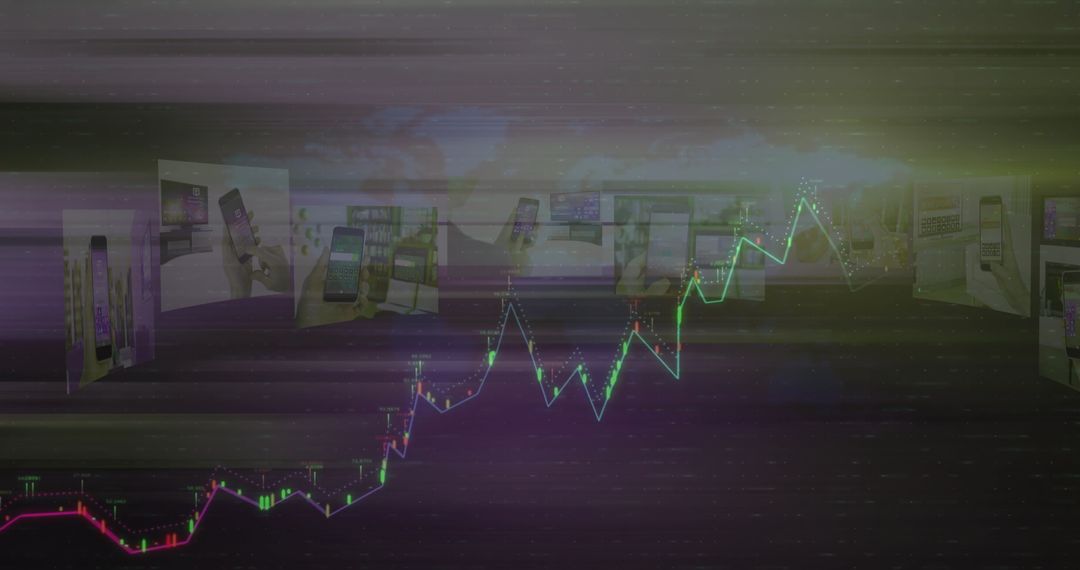
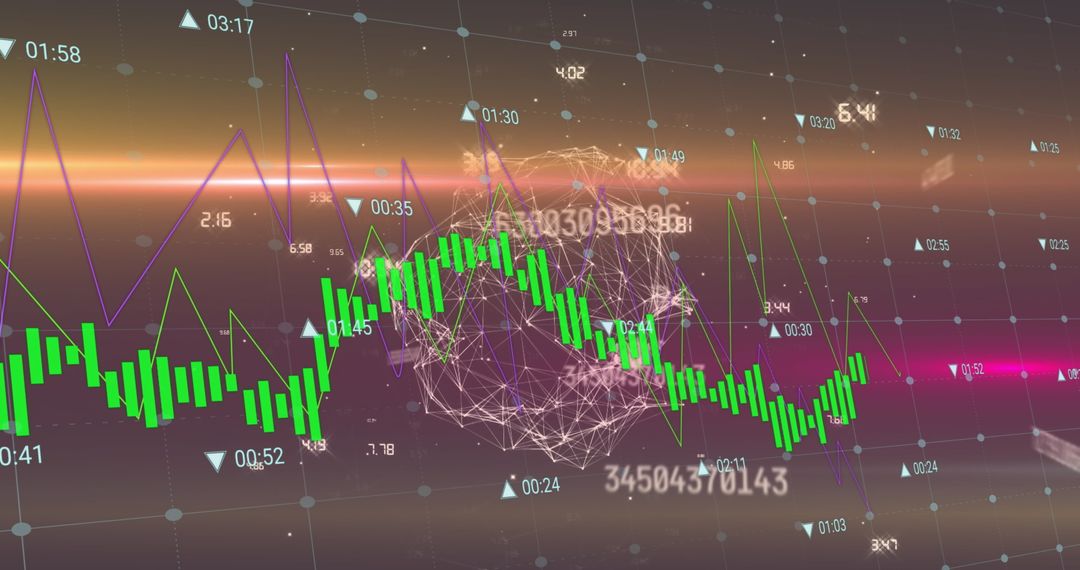
- Dynamic Financial Dashboard with Trend Lines and Candlesticks
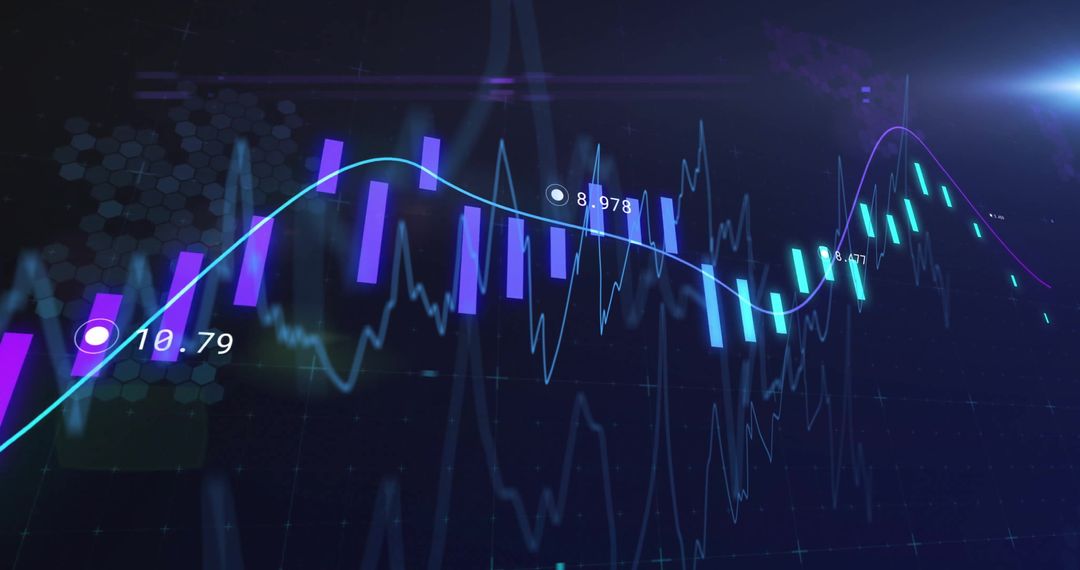
Dynamic Financial Dashboard with Trend Lines and Candlesticks Image
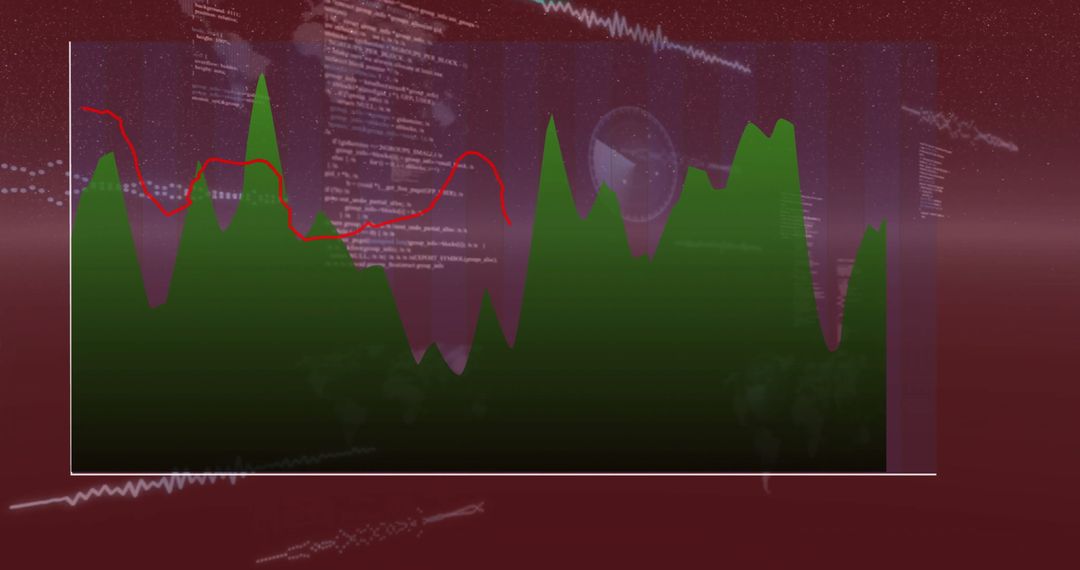
This striking digital illustration showcases an animated financial dashboard with neon green and red trend lines that zigzag across the scene, representing significant changes in financial markets. The inclusion of numbers and candlestick graphs highlights its value in depicting complex data analytics and stock market behavior. Ideal for representations in investment presentations, trading platform interfaces, financial planning guides, and modern technology blogs discussing algorithms in finance.
Powered by 


2
downloads
downloads
Tags:
More
Credit Photo
If you would like to credit the Photo, here are some ways you can do so
Text Link
photo Link
<span class="text-link">
<span>
<a target="_blank" href=https://pikwizard.com/photo/dynamic-financial-dashboard-with-trend-lines-and-candlesticks/655830615c6ed040c9881abb731af6b9/>PikWizard</a>
</span>
</span>
<span class="image-link">
<span
style="margin: 0 0 20px 0; display: inline-block; vertical-align: middle; width: 100%;"
>
<a
target="_blank"
href="https://pikwizard.com/photo/dynamic-financial-dashboard-with-trend-lines-and-candlesticks/655830615c6ed040c9881abb731af6b9/"
style="text-decoration: none; font-size: 10px; margin: 0;"
>
<img src="https://pikwizard.com/pw/medium/655830615c6ed040c9881abb731af6b9.jpg" style="margin: 0; width: 100%;" alt="" />
<p style="font-size: 12px; margin: 0;">PikWizard</p>
</a>
</span>
</span>
Free (free of charge)
Free for personal and commercial use.
Author: Authentic Images
Similar Free Stock Images

Premium


Premium


Premium


Premium
Premium


Premium


Premium


Premium


Premium


Premium


Premium


Premium


Premium

Premium


Premium

Premium


Premium


Premium


Premium
Premium


Premium


Premium


Premium


Premium