
- Home >
- Stock Photos >
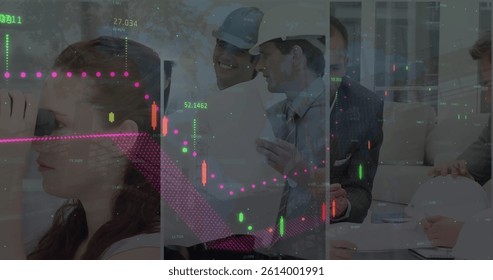
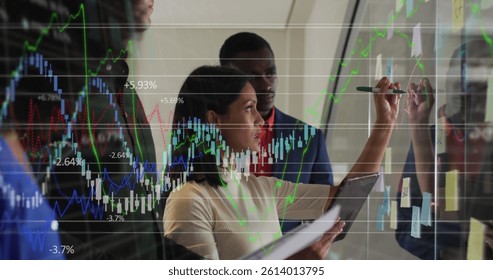
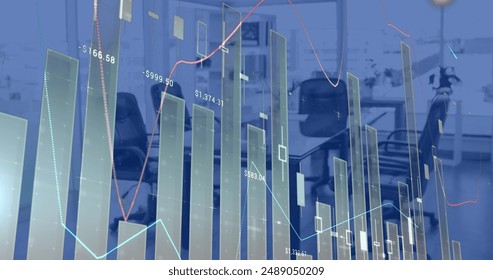
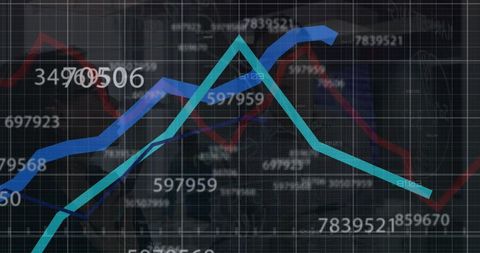
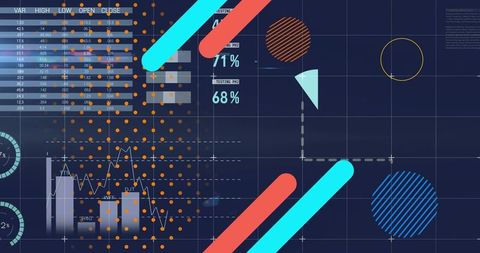
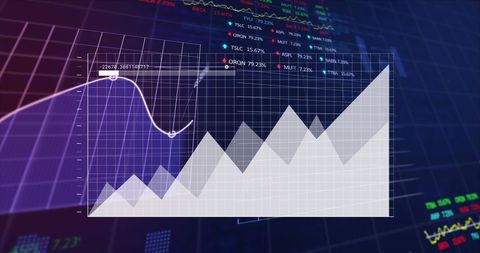
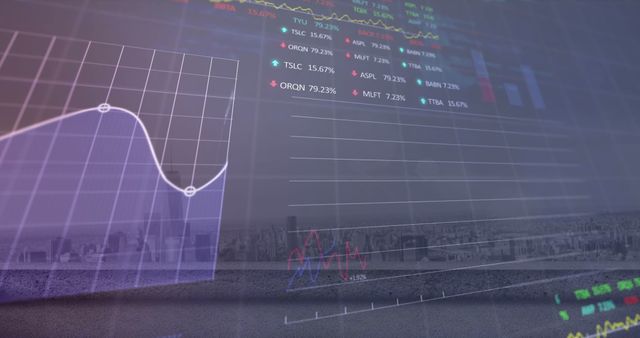
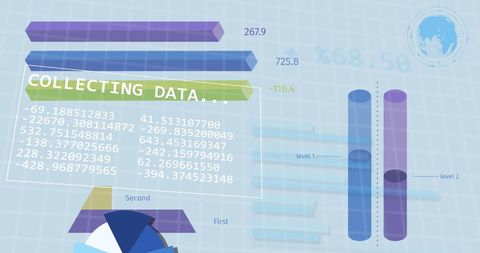
- Dynamic Financial Data Analysis and Global Trends Visualization
Dynamic Financial Data Analysis and Global Trends Visualization Image

Illustrating a conceptual representation of financial data analysis, this visualization highlights various charts and graphs with subtle digital elements. Useful for presentations on business intelligence, economic indicators, and analytics. Ideal for communicating financial insights, data processing workflows, or illustrating articles on market trends.
Powered by  - Get 15% off with code: PIKWIZARD15


downloads
Tags:
More
Credit Photo
If you would like to credit the Photo, here are some ways you can do so
Text Link
photo Link
<span class="text-link">
<span>
<a target="_blank" href=https://pikwizard.com/photo/dynamic-financial-data-analysis-and-global-trends-visualization/b63891a0ece66728628d07f84a0b6f5d/>PikWizard</a>
</span>
</span>
<span class="image-link">
<span
style="margin: 0 0 20px 0; display: inline-block; vertical-align: middle; width: 100%;"
>
<a
target="_blank"
href="https://pikwizard.com/photo/dynamic-financial-data-analysis-and-global-trends-visualization/b63891a0ece66728628d07f84a0b6f5d/"
style="text-decoration: none; font-size: 10px; margin: 0;"
>
<img src="https://pikwizard.com/pw/medium/b63891a0ece66728628d07f84a0b6f5d.jpg" style="margin: 0; width: 100%;" alt="" />
<p style="font-size: 12px; margin: 0;">PikWizard</p>
</a>
</span>
</span>
Free (free of charge)
Free for personal and commercial use.
Author: Creative Art
Similar Free Stock Images

Premium


Premium
Premium


Premium


Premium


Premium

Premium


Premium


Premium

Premium

Premium

Premium


Premium


Premium


Premium


Premium


Premium


Premium


Premium


Premium


Premium

Premium


Premium


Premium


Premium


Explore More Free Stock Images