- Home >
- Stock Photos >
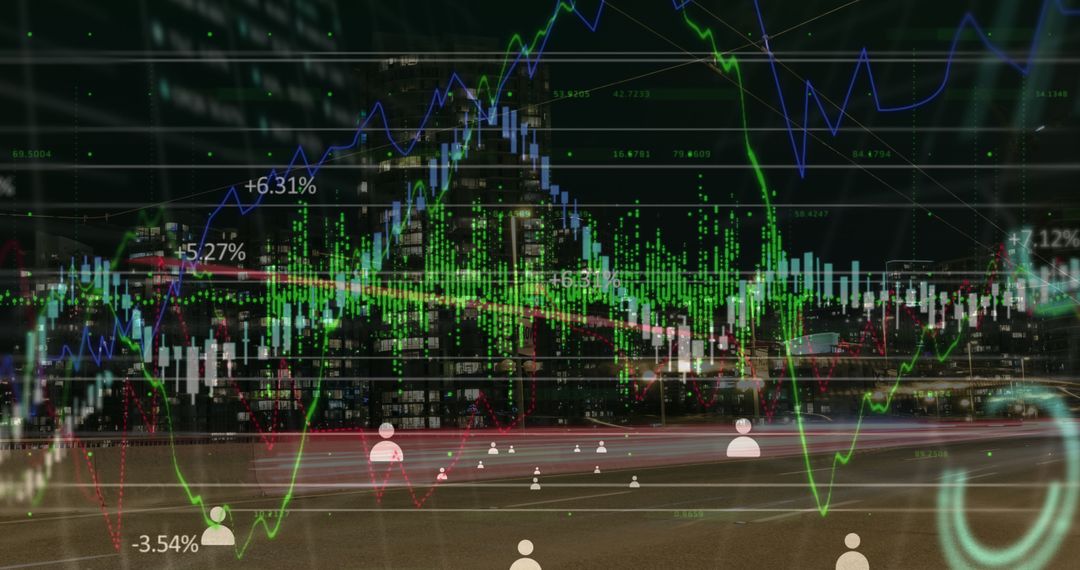
- Dynamic Financial Data Analysis Charts with Green Digital Grid
Dynamic Financial Data Analysis Charts with Green Digital Grid Image

In this conceptual image, various futuristic data elements and geometrical lines display over a vibrant green grid to depict financial market activities. Sharp chart trajectories highlight growth and downturn indicators, capturing volatility and economic trends. Using this illustration extends to journalistic articles, enhancing financial investment guides, technology blog headers discussing market strategies, and presentations focused on advancing economic forecasts through digital intrications.
Powered by 


2
downloads
downloads
Tags:
More
Credit Photo
If you would like to credit the Photo, here are some ways you can do so
Text Link
photo Link
<span class="text-link">
<span>
<a target="_blank" href=https://pikwizard.com/photo/dynamic-financial-data-analysis-charts-with-green-digital-grid/77fb612be33ceac29b23817ce1cf327e/>PikWizard</a>
</span>
</span>
<span class="image-link">
<span
style="margin: 0 0 20px 0; display: inline-block; vertical-align: middle; width: 100%;"
>
<a
target="_blank"
href="https://pikwizard.com/photo/dynamic-financial-data-analysis-charts-with-green-digital-grid/77fb612be33ceac29b23817ce1cf327e/"
style="text-decoration: none; font-size: 10px; margin: 0;"
>
<img src="https://pikwizard.com/pw/medium/77fb612be33ceac29b23817ce1cf327e.jpg" style="margin: 0; width: 100%;" alt="" />
<p style="font-size: 12px; margin: 0;">PikWizard</p>
</a>
</span>
</span>
Free (free of charge)
Free for personal and commercial use.
Author: Creative Art
Similar Free Stock Images

Premium


Premium


Premium


Premium


Premium


Premium


Premium


Premium


Premium


Premium


Premium


Premium


Premium


Premium


Premium


Premium


Premium


Premium


Premium


Premium


Premium


Premium


Premium


Premium