- Home >
- Stock Photos >
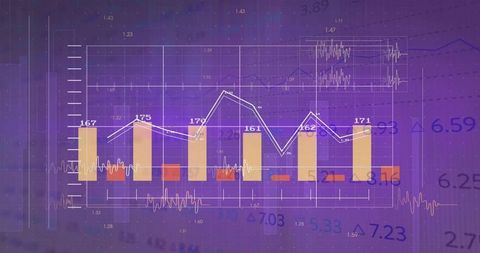
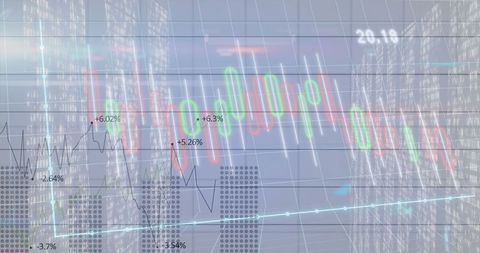
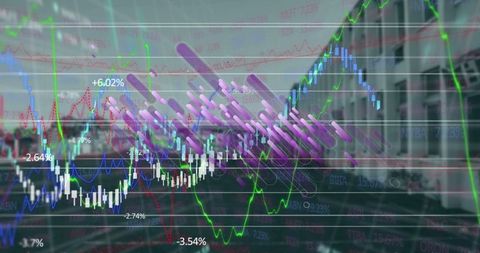
- Dynamic Financial Data Analysis Interface with Digital Charts
Dynamic Financial Data Analysis Interface with Digital Charts Image

Abstract representation of a financial trading interface with various digital charts and binary code elements. Suitable for financial or investment websites, technology demonstration for data analysis, and presentations featuring market trends and analytics developments.

downloads
Tags:
More
Credit Photo
If you would like to credit the Photo, here are some ways you can do so
Text Link
photo Link
<span class="text-link">
<span>
<a target="_blank" href=https://pikwizard.com/photo/dynamic-financial-data-analysis-interface-with-digital-charts/303d590b1e12d132e92c25982c396a01/>PikWizard</a>
</span>
</span>
<span class="image-link">
<span
style="margin: 0 0 20px 0; display: inline-block; vertical-align: middle; width: 100%;"
>
<a
target="_blank"
href="https://pikwizard.com/photo/dynamic-financial-data-analysis-interface-with-digital-charts/303d590b1e12d132e92c25982c396a01/"
style="text-decoration: none; font-size: 10px; margin: 0;"
>
<img src="https://pikwizard.com/pw/medium/303d590b1e12d132e92c25982c396a01.jpg" style="margin: 0; width: 100%;" alt="" />
<p style="font-size: 12px; margin: 0;">PikWizard</p>
</a>
</span>
</span>
Free (free of charge)
Free for personal and commercial use.
Author: Creative Art