
- Home >
- Stock Photos >
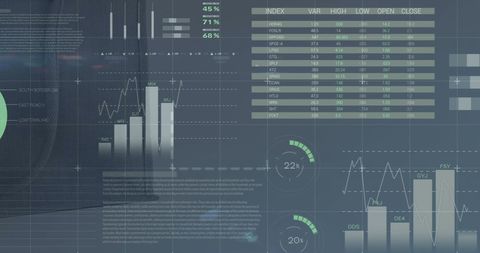
- Dynamic Financial Data Analysis on Blue Digital Interface
Dynamic Financial Data Analysis on Blue Digital Interface Image

Abstract representation of financial data processing with various charts and graphs on a blue interface. Ideal for content on data analysis, business forecasts, stock market algorithms, and technology in finance. Useful for illustrating concepts in finance articles, analysis software, and educational materials related to economics.
Powered by 


downloads
Tags:
More
Credit Photo
If you would like to credit the Photo, here are some ways you can do so
Text Link
photo Link
<span class="text-link">
<span>
<a target="_blank" href=https://pikwizard.com/photo/dynamic-financial-data-analysis-on-blue-digital-interface/bac13ead7b282d0bace4badf2d774a08/>PikWizard</a>
</span>
</span>
<span class="image-link">
<span
style="margin: 0 0 20px 0; display: inline-block; vertical-align: middle; width: 100%;"
>
<a
target="_blank"
href="https://pikwizard.com/photo/dynamic-financial-data-analysis-on-blue-digital-interface/bac13ead7b282d0bace4badf2d774a08/"
style="text-decoration: none; font-size: 10px; margin: 0;"
>
<img src="https://pikwizard.com/pw/medium/bac13ead7b282d0bace4badf2d774a08.jpg" style="margin: 0; width: 100%;" alt="" />
<p style="font-size: 12px; margin: 0;">PikWizard</p>
</a>
</span>
</span>
Free (free of charge)
Free for personal and commercial use.
Author: Authentic Images
Similar Free Stock Images

Premium


Premium


Premium


Premium


Premium


Premium


Premium


Premium


Premium


Premium


Premium


Premium


Premium


Premium

Premium


Premium


Premium


Premium


Premium


Premium


Premium

Premium


Premium

Premium

Premium


Explore More Free Stock Images