- Home >
- Stock Photos >
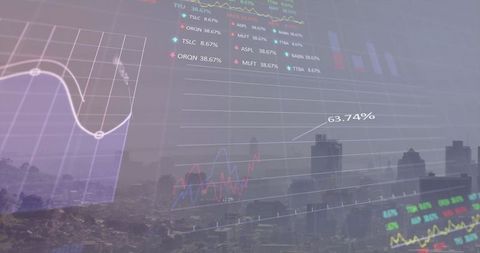
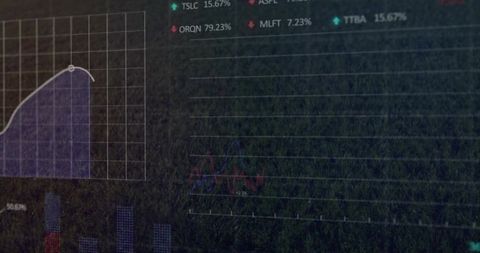
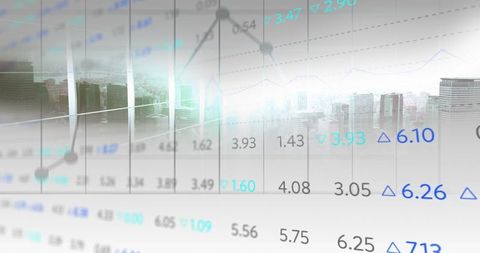
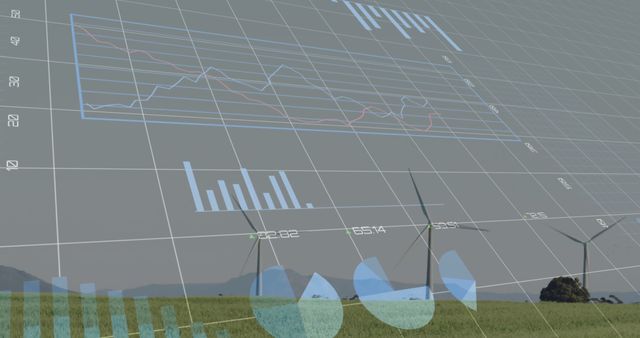
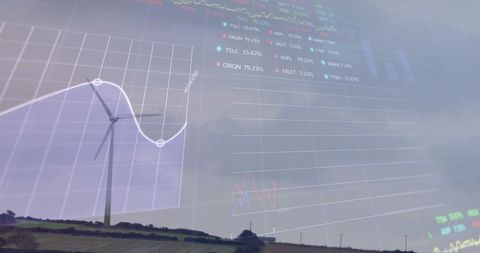
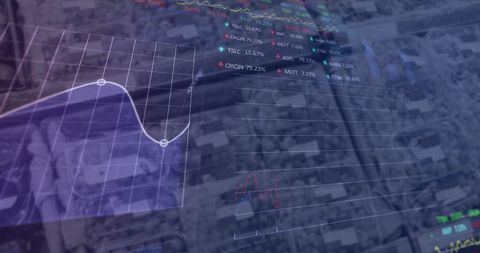
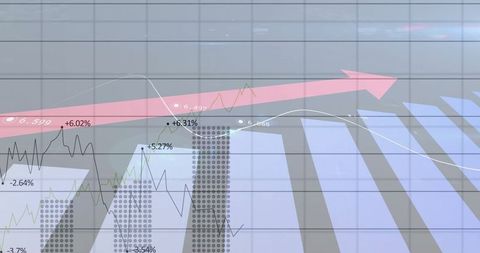
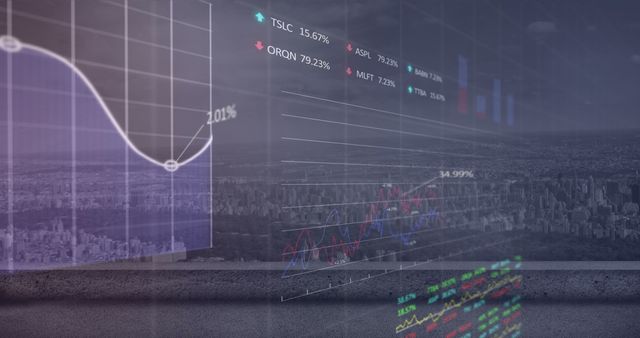
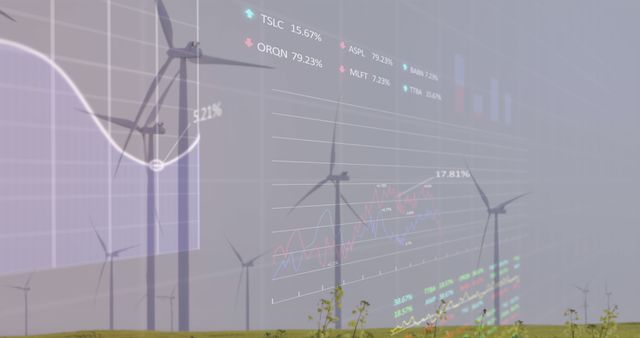
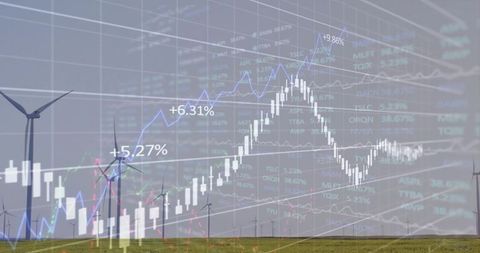
- Dynamic Financial Data Analysis with Arrows
Dynamic Financial Data Analysis with Arrows Image

Abstract representation of financial data and trends. This image is useful for financial reports, investment presentations, or articles discussing stock market growth and predictive analytics in global business contexts. It illustrates economic trends and digital data processing with futuristic arrows suggesting positive growth.

downloads
Tags:
More
Credit Photo
If you would like to credit the Photo, here are some ways you can do so
Text Link
photo Link
<span class="text-link">
<span>
<a target="_blank" href=https://pikwizard.com/photo/dynamic-financial-data-analysis-with-arrows/1a6627b4a0b1588ea60d988d4f88b67b/>PikWizard</a>
</span>
</span>
<span class="image-link">
<span
style="margin: 0 0 20px 0; display: inline-block; vertical-align: middle; width: 100%;"
>
<a
target="_blank"
href="https://pikwizard.com/photo/dynamic-financial-data-analysis-with-arrows/1a6627b4a0b1588ea60d988d4f88b67b/"
style="text-decoration: none; font-size: 10px; margin: 0;"
>
<img src="https://pikwizard.com/pw/medium/1a6627b4a0b1588ea60d988d4f88b67b.jpg" style="margin: 0; width: 100%;" alt="" />
<p style="font-size: 12px; margin: 0;">PikWizard</p>
</a>
</span>
</span>
Free (free of charge)
Free for personal and commercial use.
Author: Awesome Content