- Home >
- Stock Photos >
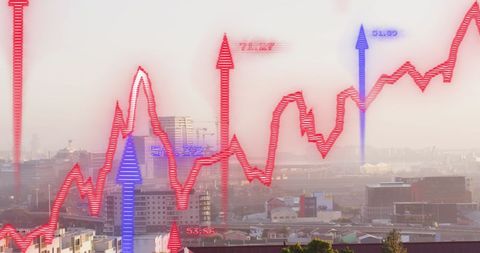
- Dynamic Financial Data Analysis with Graph Overlays
Dynamic Financial Data Analysis with Graph Overlays Image

A vibrant image depicting financial data processing with dynamic graph overlays highlighting market trends. Red arrows indicate fluctuations against a blue background symbolizing global connectivity and data analysis. Ideal for use in presentations related to stock market insights, technology-driven finance projects, and educational content on data visualization. Useful for illustrating concepts of global market strategies and digital trading platforms.

downloads
Tags:
More
Credit Photo
If you would like to credit the Photo, here are some ways you can do so
Text Link
photo Link
<span class="text-link">
<span>
<a target="_blank" href=https://pikwizard.com/photo/dynamic-financial-data-analysis-with-graph-overlays/2fc1657b0afb54ab55ef543e97314b6e/>PikWizard</a>
</span>
</span>
<span class="image-link">
<span
style="margin: 0 0 20px 0; display: inline-block; vertical-align: middle; width: 100%;"
>
<a
target="_blank"
href="https://pikwizard.com/photo/dynamic-financial-data-analysis-with-graph-overlays/2fc1657b0afb54ab55ef543e97314b6e/"
style="text-decoration: none; font-size: 10px; margin: 0;"
>
<img src="https://pikwizard.com/pw/medium/2fc1657b0afb54ab55ef543e97314b6e.jpg" style="margin: 0; width: 100%;" alt="" />
<p style="font-size: 12px; margin: 0;">PikWizard</p>
</a>
</span>
</span>
Free (free of charge)
Free for personal and commercial use.
Author: Authentic Images