
- Home >
- Stock Photos >
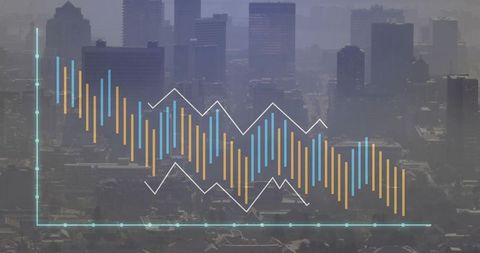
- Dynamic Financial Data Analysis with Illuminated Graphs
Dynamic Financial Data Analysis with Illuminated Graphs Image

Glowing composite of financial graphs illustrating dynamic data analysis against gray digital background. Represents global market insights and digital transformation. Ideal for illustrating fintech articles, economist reports, or business analytics presentations aiming to convey advanced data interpretation.
Powered by  - Get 15% off with code: PIKWIZARD15


downloads
Tags:
More
Credit Photo
If you would like to credit the Photo, here are some ways you can do so
Text Link
photo Link
<span class="text-link">
<span>
<a target="_blank" href=https://pikwizard.com/photo/dynamic-financial-data-analysis-with-illuminated-graphs/b02c8f53c5d2791ee988b6e832092f52/>PikWizard</a>
</span>
</span>
<span class="image-link">
<span
style="margin: 0 0 20px 0; display: inline-block; vertical-align: middle; width: 100%;"
>
<a
target="_blank"
href="https://pikwizard.com/photo/dynamic-financial-data-analysis-with-illuminated-graphs/b02c8f53c5d2791ee988b6e832092f52/"
style="text-decoration: none; font-size: 10px; margin: 0;"
>
<img src="https://pikwizard.com/pw/medium/b02c8f53c5d2791ee988b6e832092f52.jpg" style="margin: 0; width: 100%;" alt="" />
<p style="font-size: 12px; margin: 0;">PikWizard</p>
</a>
</span>
</span>
Free (free of charge)
Free for personal and commercial use.
Author: Authentic Images
Similar Free Stock Images

Premium


Premium


Premium


Premium


Premium


Premium


Premium


Premium

Premium


Premium


Premium


Premium


Premium


Premium


Premium

Premium


Premium


Premium


Premium


Premium


Premium


Premium


Premium


Premium


Premium


Explore More Free Stock Images