
- Home >
- Stock Photos >
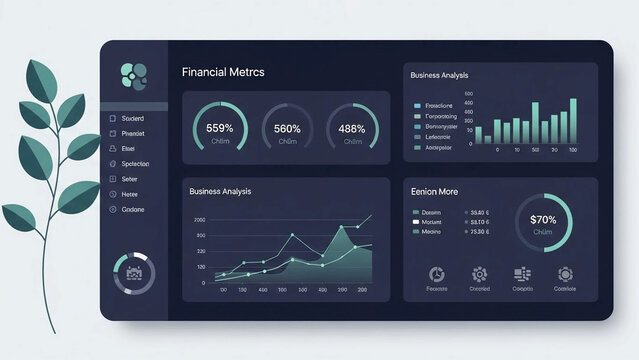
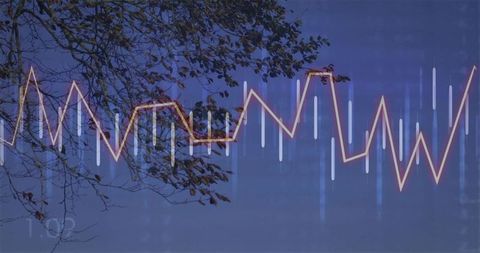
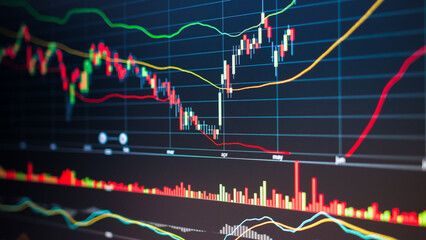
- Dynamic Financial Data Analytics Display on Dark Background
Dynamic Financial Data Analytics Display on Dark Background Image

This image shows dynamic financial data represented in bar charts and numerical analyses over a dark, digital background. Ideal for illustrating concepts related to finance, business analytics, data processing, and technology in presentations, articles, and online content where visualizing global data flow is important.
Powered by 


downloads
Tags:
More
Credit Photo
If you would like to credit the Photo, here are some ways you can do so
Text Link
photo Link
<span class="text-link">
<span>
<a target="_blank" href=https://pikwizard.com/photo/dynamic-financial-data-analytics-display-on-dark-background/0dbf15cda2920d83404c7020500a2d48/>PikWizard</a>
</span>
</span>
<span class="image-link">
<span
style="margin: 0 0 20px 0; display: inline-block; vertical-align: middle; width: 100%;"
>
<a
target="_blank"
href="https://pikwizard.com/photo/dynamic-financial-data-analytics-display-on-dark-background/0dbf15cda2920d83404c7020500a2d48/"
style="text-decoration: none; font-size: 10px; margin: 0;"
>
<img src="https://pikwizard.com/pw/medium/0dbf15cda2920d83404c7020500a2d48.jpg" style="margin: 0; width: 100%;" alt="" />
<p style="font-size: 12px; margin: 0;">PikWizard</p>
</a>
</span>
</span>
Free (free of charge)
Free for personal and commercial use.
Author: People Creations
Similar Free Stock Images

Premium


Premium

Premium


Premium


Premium


Premium


Premium


Premium


Premium

Premium

Premium


Premium


Premium


Premium


Premium


Premium


Premium


Premium


Premium

Premium


Premium

Premium


Premium
Premium


Premium

Explore More Free Stock Images