
- Home >
- Stock Photos >
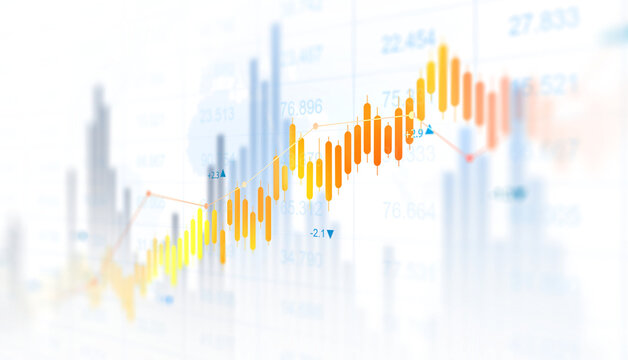
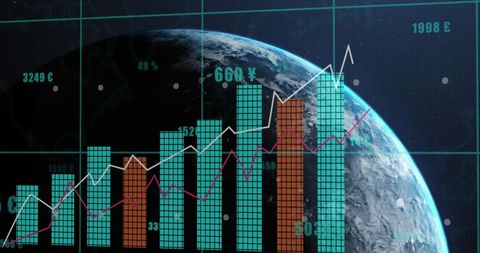
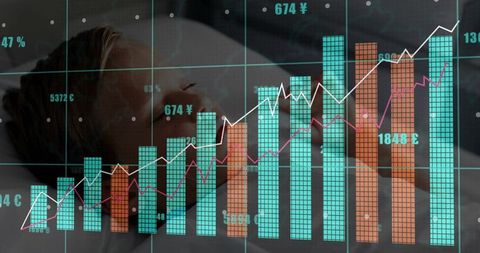
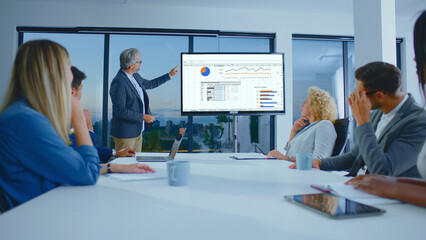
- Dynamic Financial Data Analytics in Digital Office Environment
Dynamic Financial Data Analytics in Digital Office Environment Image

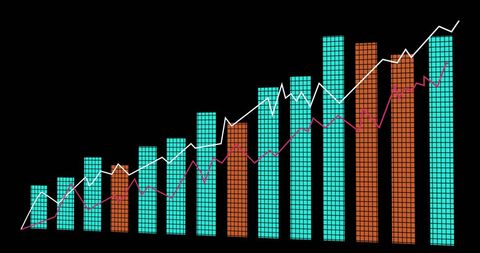
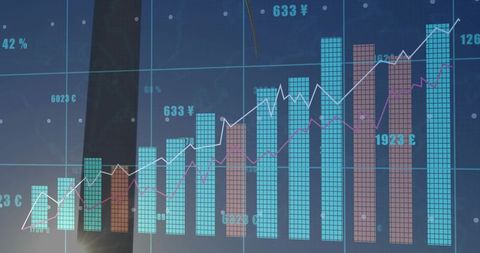
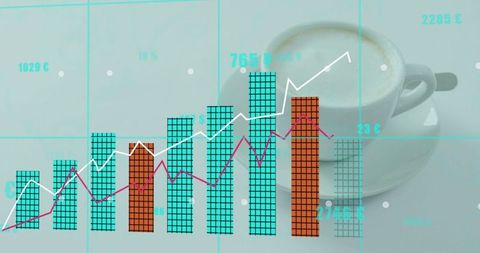
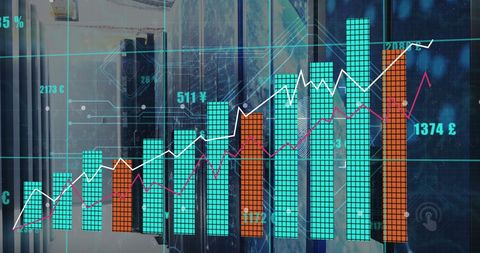
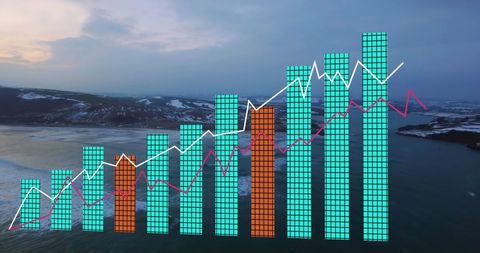
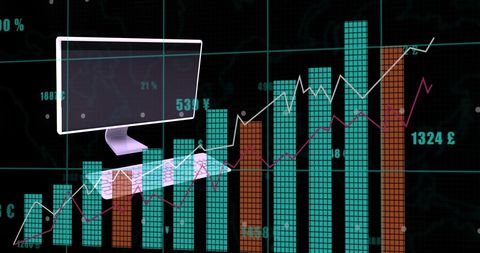
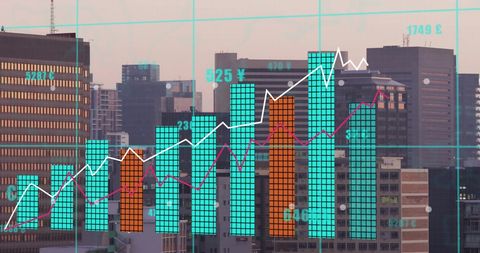
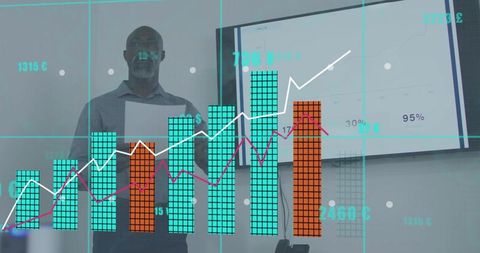
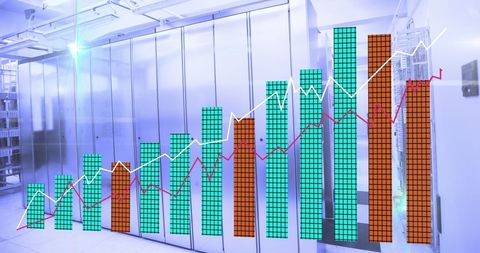
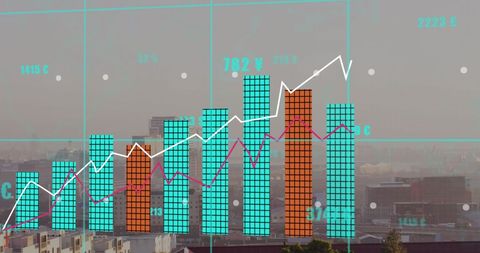
This image shows a digital display of financial data with graphs, charts, and currency symbols. Perfect for illustrating concepts in finance, data analytics, the stock market, and global business trends. Ideal for use in corporate presentations, financial advertisements, or articles about economic forecasting and data processing technology.
Powered by 


downloads
Tags:
More
Credit Photo
If you would like to credit the Photo, here are some ways you can do so
Text Link
photo Link
<span class="text-link">
<span>
<a target="_blank" href=https://pikwizard.com/photo/dynamic-financial-data-analytics-in-digital-office-environment/86341b5ba8fd492c2aec2ac68e49b813/>PikWizard</a>
</span>
</span>
<span class="image-link">
<span
style="margin: 0 0 20px 0; display: inline-block; vertical-align: middle; width: 100%;"
>
<a
target="_blank"
href="https://pikwizard.com/photo/dynamic-financial-data-analytics-in-digital-office-environment/86341b5ba8fd492c2aec2ac68e49b813/"
style="text-decoration: none; font-size: 10px; margin: 0;"
>
<img src="https://pikwizard.com/pw/medium/86341b5ba8fd492c2aec2ac68e49b813.jpg" style="margin: 0; width: 100%;" alt="" />
<p style="font-size: 12px; margin: 0;">PikWizard</p>
</a>
</span>
</span>
Free (free of charge)
Free for personal and commercial use.
Author: Authentic Images
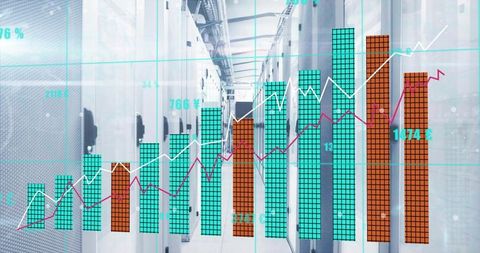
Similar Free Stock Images

Premium


Premium

Premium


Premium


Premium


Premium


Premium

Premium


Premium


Premium


Premium


Premium

Premium


Premium

Premium

Premium


Premium


Premium
Premium


Premium


Premium


Premium


Premium


Premium


Premium

Explore More Free Stock Images