1. Home > 
  2. Stock Photos > 
  3. Dynamic Financial Data Analytics with Charts and Graphs

Dynamic Financial Data Analytics with Charts and Graphs Image

Dynamic Financial Data Analytics with Charts and Graphs

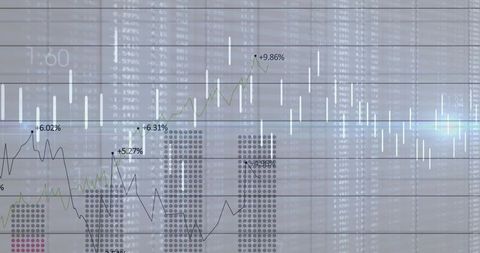
Ideal for use in presentations on investment strategies, market analysis, or financial technology tools. Highlights statistical and analytical technology used in finance. Useful in educational materials to demonstrate concepts related to statistical trends and data analysis in global markets.

Powered by Shutterstock logo - Get 15% off with code: PIKWIZARD15
Person analyzing financial growth bar chart on laptop and tablet screen. Concept of business performance, success, data analytics, and digital marketing strategy in modern economy. - Powered by Shutterstock - Get 15% off with code: PIKWIZARD15Business data analytics and intelligence dashboard concept, businessman using futuristic holographic graphs and charts on laptop, big data analysis, KPIs, statistics, digital transformation. - Powered by Shutterstock - Get 15% off with code: PIKWIZARD15Data analytics dashboard with charts, indicators, and performance metrics, reveals trends, data analytics drives growth, supports insight, and data analytics improves decisions. Vouch - Powered by Shutterstock - Get 15% off with code: PIKWIZARD15Businessman analyzing digital dashboard with futuristic charts and diagrams on transparent virtual screen, concept of data analysis - Powered by Shutterstock - Get 15% off with code: PIKWIZARD15analysis, finance, investment, chart, market, profit, data, accounting, growth, Business person analyzing financial data on a digital tablet with stylus, showing growth and investment charts. - Powered by Shutterstock - Get 15% off with code: PIKWIZARD15

Credit Photo

If you would like to credit the Photo, here are some ways you can do so

Free (free of charge)

Free for personal and commercial use.

Author: People Creations

Similar Free Stock Images

Digital Financial Data Analysis with Infographics and Charts
Premium
Marketing agency diverse workers analyzing research results, paper reports with diagrams on meeting table, discussing business startup creative strategy, planning finance, expenses, profit
Dynamic Stock Market Graph with Fluctuating Data Bars
Digital Data Visualization with Trend Lines and Percentage Changes
Premium
Person using laptop with digital analytics dashboard overlay, modern graphic style, on dark background. Concept of data analysis and technology
Dynamic Digital Stock Market Ticker with Growing Graph Trends
Dynamic Stock Market Analysis with Digital Graph Lines
Data Analytics Graphs on Digital Interface Background
Dynamic Financial Graphs and Data Analysis Interface
Premium
Analyst utilizing technology and dashboard with charts data science and Big Data technology for business, Strategic data management system with KPI organization performance with technology and metrics
Financial Chart Analysis with Digital Grid Interface
Digital Interface with Data Analysis and Code in Console
Dynamic Stock Market Graph Showing Investment Trends
Financial Data Processing Visualization with Green Digital Grid
Premium
Data analyzing and stock market visualization with digital charts, financial dashboards, and performance metrics. Ideal for investment analysis, trading strategy, and economic forecasting.
Financial Dashboard with Data Visualization and Social Interaction Metrics
Financial Data Visualization with Cityscape Overlay
Candlestick trading chart displaying trend lines, indicators and percentage labels
AI
Futuristic Finance Dashboard with Market Data Visualization
Financial Data Processing with Rising Graphs
Financial Data Line Graph on Digital Display
Dynamic Financial Stock Market Analysis Display
Holographic Financial Data Visualization with Stock Trends
Digital Fingerprint on Cybersecurity Dashboard with Data Charts
Abstract Data Visualization with Dynamic Charts and Graphs
Premium
Businesswomen discussing consumer demographics displayed on a computer screen during an office meeting, analyzing market data for strategic decision-making
Digital Currency Trading Interface with Data Visualization
Futuristic Financial Data Analysis with Graphs and Charts
Dynamic Digital Financial Data Interface Background
Dynamic Financial Data Overlaid on Grid Background
Premium
Stethoscope on chart paper, Financial, account, statistics and business data medical health.
Dynamic Financial Growth Digital Chart Display
Financial Data Charts with World Map on Blue Digital Background
Dynamic Stock Market Chart with Fluctuating Trends and Data Points
Fluctuating Financial Graph on Green Grid Background
Dynamic Financial Data Graph in Digital Grid Display
Digital Finance: Modern Stock Market Analysis Display
Premium
Hands, person and graph on tablet screen at house of accounting, finance report and profit growth. Accountant, digital and budget for financial stats, revenue increase and data analysis of investment
Premium
Business data analysis dashboard showing charts, statistics, and performance metrics for decision-making, revenue tracking, and strategic planning in organizations Latch
Dynamic Stock Market Data Visualization on Digital Screen
Financial Data Analytics on Digital Interface Displaying Graphs
Digital Data Analysis and Visualization with Line Graph
Cityscape with Digital Stock Market Graphs and Statistics
Premium
Futuristic Digital Growth Chart – 3D Bar Graph with Glowing Blue Data Visualization
Financial Data Visualization on Blue Background
Abstract Financial Data Processing and Analysis Interface
Data Analysis with Advanced Technology Interface Details Profusion
Analyzing Accelerating Data Trends on Grid with Tech Insights
Dynamic Digital Market Analysis with Holographic Data
Dynamic Financial Graphs Illustrating Market Trends
Financial Data Display in Digital Grid Design
Premium
Dashboard finance management on laptop computer analyzing sales data and growth graph chart report. Business planning, strategy and development. Financial accounting. market research, data analysis
Dynamic Financial Data Visualization over Urban Silhouette
Financial Data Visualization with Rising Trends
Financial Stock Market Data Analysis on Digital Interface
Premium
Business team startup presenting data summary chart meeting with colleagues, financial report analysis teamwork strategy planning corporate success at office, marketing, data analytics
Premium
Business team present. investor working new start up project. tablet laptop computer with digital marketing media in virtual icon design Finance managers meeting.
Global Economic Trends Highlighted on World Map with Graphs
Financial Data Analysis in Digital Interface with Graphs
Dynamic Financial Graphs Over Cityscape Background
Trend Analysis with Candlestick Chart and Data Indicators
Premium
AI enhances business data analytics by automating dashboards, visualizing statistics, and supporting strategic decisions through real-time performance insights Vouch
Digital Financial Data Visualizations on Blue Interface
Financial Data Display with Dynamic Digital Graph
World Map with Falling Line Graphs Indicating Global Economic Decline
Premium
Conceptual visual of data analysis with black woman working in the office
Premium
A diverse business team engages in collaborative data analysis using charts and graphs displayed on a tablet, surrounded by reports in a modern office setting. SACTR
Futuristic Digital Data Stream with Dynamic Graph Overlay
Analyzing Stock Market Trends with Candlestick Chart and Data Visualization
Financial Graphs with Social Media Analytics on Digital Chart
Abstract Financial Stock Market Graph Overlay on Digital Interface
Premium
Internet cyberspace data information collection analytical statistics computer storage ai artificial intelligence calculation, blue background banner copyspace.
Futuristic Data Visualization with Dynamic Graphs and Digital Globe
Advanced Data Visualization on Finance Dashboard
Premium
kpi, analytics, dashboard, data, chart, A person analyzing digital KPI dashboards and charts on a laptop, representing performance metrics, data analytics, and business strategy.
Dynamic Financial Data with Overlaid Cityscape Interface
Premium
Data analytics and graphs. Analysis of statistical business marketing data. Data scientist using laptop computer to analyze data. analysis, marketing strategy or statistics by business development
Rising Graphs and Interactive Financial Data Analytics Background
Financial Data Analysis with Interactive Graphs
Dynamic Financial Data Against Urban Skyline
Premium
Financial growth strategy leverages data analytics for investment optimization and market performance Parse
Premium
Businessman analyzing virtual graph chart on laptop screen. Concept of data analysis, financial growth, performance tracking, digital technology, and business intelligence.
Digital Data and Financial Charts on White Background
AI
Colorful Financial Data Display on Digital Screen for Trading and Analytics
Premium
Big data and analytics support real-time insights, predictive modeling, and data-driven decisions for business intelligence and growth. Latch
Dynamic Data Visualization with Financial Charts and 3D Elements
Data Analysis Graphics on Digital Grid Background
Financial Graphs Over Candlestick Chart Indicating Stock Fluctuations
Dynamic Financial Graph with Candlestick Patterns and Percentage Metrics
Premium
2026 Business finance data analytics graph. Businessmen use smartphone analytics targets and financial management, cost plans, HR, KPI, Corporate strategy finance, operations, sales, Marketin
Premium
Business graphs, hands and discussion with tablet screen for data analysis, revenue performance or profit growth. Closeup, investors or statistics for budget forecasting, financial feedback or report
Vibrant Waveform Analysis on Futuristic Trading Screen
Colorful Stock Market Display with Graphs and Tickers on Blue Background
Dynamic Financial Graphs with Glowing Lens Flares and Data Points
Dynamic Financial Data Chart Display with Graphical Analysis
Dynamic Forex Trading Graphs with Increasing Numbers
Futuristic Neon Green Data Visualization on Grid Background
Dynamic Graphic of Financial Data Displayed on Graph
Abstract Digital Financial Chart on Blue Background
Global Financial Data Analysis with World Map Visualization
Digital Analysis of Financial Data with Dynamic Graphs
Financial Data Analyzing with Blue Digital Interface Background
Digital Financial Data Overlay on Urban Street Scene
Stock Market Candlestick Chart with Green Data Overlay
Financial Growth Chart with Data Visualization Elements
Dynamic Data Visualization and Financial Growth Curves
Digital Data Processing with Graphical Interface
Dynamic Stock Market Analytics Display on Blue Background
Holographic Financial Stock Market Analysis Visualization
Premium
A business team collaborates over data analysis with modern technology dashboards and graphs on the table, enhancing strategic decision-making and performance insights. Trope
Financial Data Charts and Graphs on Digital Interface
Colorful Data Visualization Graphs on Digital Grid
Fluctuating Digital Stock Market Data Chart
Dynamic Digital Soundwave Pattern on Dark Background
Premium
Big data and analytics support real-time insights, predictive modeling, and data-driven decisions for business intelligence and growth. Latch
Dynamic Stock Market Graphs Over Digital Interface
Dynamic Digital Data Analysis on Elevated Grid
Dynamic Financial Market Trends with Data Visualizations
Rising Digital Graph and Data Visualizations on Black Background
Abstract Digital Graph with Data Points and Grid
Transforming Data and Financial Analysis on Pink Graph
Financial Growth Graph and Data Analytics Representation
Financial Data Charts in Shimmering Blue Digital Space
Dynamic Financial Graph on Digital Background
Dynamic Stock Market Data Analysis With Graphs and Percentages
Explore More Free Stock Images