
- Home >
- Stock Photos >
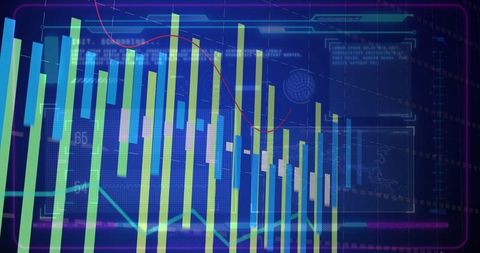
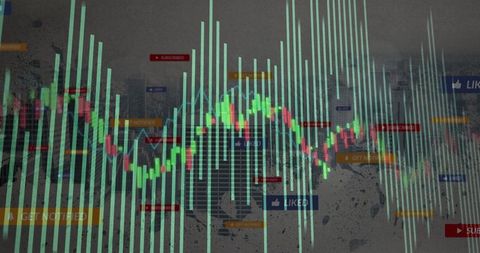
- Dynamic Financial Data Analytics with Global Technology Perspectives
Dynamic Financial Data Analytics with Global Technology Perspectives Image

A futuristic representation of digital finance and technology focusing on data analytics and global connectivity. Displays a series of graphs and statistical representations on a dark screen, symbolizing modern digital analytics and business intelligence. Ideal for illustrating concepts of data processing, financial market trends, or digital technology in business present-hation. Use in financial blogs, technology office backgrounds, or educational resources on data analytics.
Powered by 


downloads
Tags:
More
Credit Photo
If you would like to credit the Photo, here are some ways you can do so
Text Link
photo Link
<span class="text-link">
<span>
<a target="_blank" href=https://pikwizard.com/photo/dynamic-financial-data-analytics-with-global-technology-perspectives/f2ef7b1827cc393e412a4a9aa55063cb/>PikWizard</a>
</span>
</span>
<span class="image-link">
<span
style="margin: 0 0 20px 0; display: inline-block; vertical-align: middle; width: 100%;"
>
<a
target="_blank"
href="https://pikwizard.com/photo/dynamic-financial-data-analytics-with-global-technology-perspectives/f2ef7b1827cc393e412a4a9aa55063cb/"
style="text-decoration: none; font-size: 10px; margin: 0;"
>
<img src="https://pikwizard.com/pw/medium/f2ef7b1827cc393e412a4a9aa55063cb.jpg" style="margin: 0; width: 100%;" alt="" />
<p style="font-size: 12px; margin: 0;">PikWizard</p>
</a>
</span>
</span>
Free (free of charge)
Free for personal and commercial use.
Author: Awesome Content
Similar Free Stock Images

Premium


Premium


Premium


Premium

Premium


Premium


Premium


Premium

Premium


Premium


Premium

Premium

Premium

Premium


Premium

Premium


Premium


Premium


Premium

Premium


Premium


Premium

Premium


Premium


Premium

Explore More Free Stock Images