- Home >
- Stock Photos >
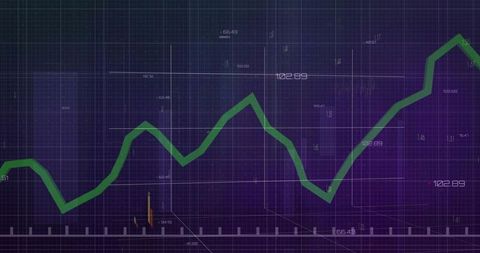
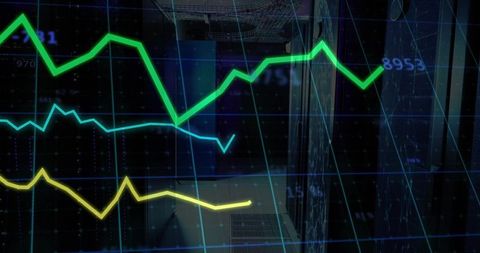
- Dynamic Financial Data Analyzing with Graph Overlays
Dynamic Financial Data Analyzing with Graph Overlays Image

Vibrant graphs overlaid on dark grid background depicting financial data analysis exemplify concepts of global finance and economics. Ideal for use in presentations or articles emphasizing data processing, analytics, or stock market investing. Useful for marketing materials focusing on financial services or investment strategies.

downloads
Tags:
More
Credit Photo
If you would like to credit the Photo, here are some ways you can do so
Text Link
photo Link
<span class="text-link">
<span>
<a target="_blank" href=https://pikwizard.com/photo/dynamic-financial-data-analyzing-with-graph-overlays/04f13080533ed1682567ea0d7065f17b/>PikWizard</a>
</span>
</span>
<span class="image-link">
<span
style="margin: 0 0 20px 0; display: inline-block; vertical-align: middle; width: 100%;"
>
<a
target="_blank"
href="https://pikwizard.com/photo/dynamic-financial-data-analyzing-with-graph-overlays/04f13080533ed1682567ea0d7065f17b/"
style="text-decoration: none; font-size: 10px; margin: 0;"
>
<img src="https://pikwizard.com/pw/medium/04f13080533ed1682567ea0d7065f17b.jpg" style="margin: 0; width: 100%;" alt="" />
<p style="font-size: 12px; margin: 0;">PikWizard</p>
</a>
</span>
</span>
Free (free of charge)
Free for personal and commercial use.
Author: Creative Art