
- Home >
- Stock Photos >
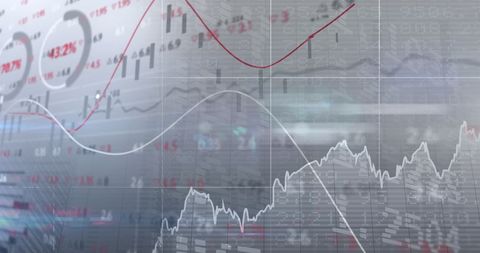
- Dynamic Financial Data and Analysis Display
Dynamic Financial Data and Analysis Display Image

Digital portrayal of fluctuating financial data, perfect for businesses, financial advisories or investors delving into market analysis, stock trends, or showcasing economic technology advancements. Ideal for illustrating articles, presentations, or resources related to global finance developments.
Powered by  - Get 15% off with code: PIKWIZARD15


downloads
Tags:
More
Credit Photo
If you would like to credit the Photo, here are some ways you can do so
Text Link
photo Link
<span class="text-link">
<span>
<a target="_blank" href=https://pikwizard.com/photo/dynamic-financial-data-and-analysis-display/62eb45131d078675fc4c675d93c9c51a/>PikWizard</a>
</span>
</span>
<span class="image-link">
<span
style="margin: 0 0 20px 0; display: inline-block; vertical-align: middle; width: 100%;"
>
<a
target="_blank"
href="https://pikwizard.com/photo/dynamic-financial-data-and-analysis-display/62eb45131d078675fc4c675d93c9c51a/"
style="text-decoration: none; font-size: 10px; margin: 0;"
>
<img src="https://pikwizard.com/pw/medium/62eb45131d078675fc4c675d93c9c51a.jpg" style="margin: 0; width: 100%;" alt="" />
<p style="font-size: 12px; margin: 0;">PikWizard</p>
</a>
</span>
</span>
Free (free of charge)
Free for personal and commercial use.
Author: Creative Art
Similar Free Stock Images

Premium


Premium


Premium


Premium

Premium


Premium


Premium


Premium

Premium

Premium

Premium

Premium


Premium


Premium


Premium


Premium


Premium


Premium


Premium


Premium


Premium


Premium


Premium


Premium

Premium

Explore More Free Stock Images