
- Home >
- Stock Photos >
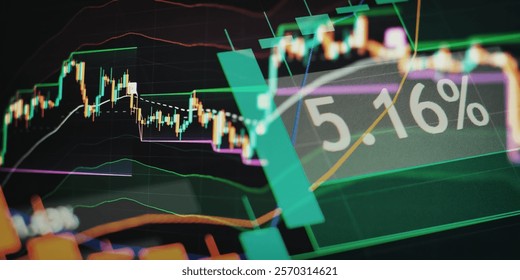
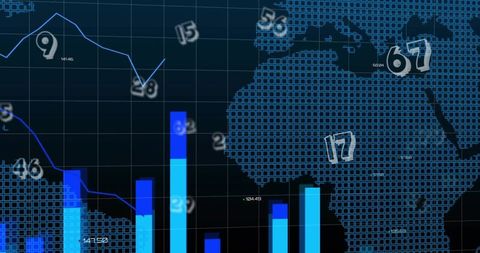
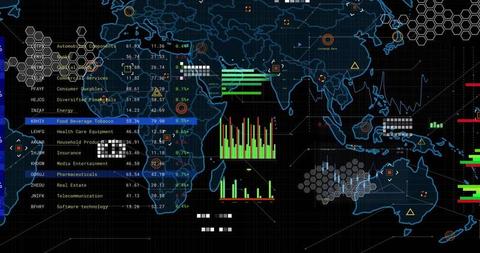
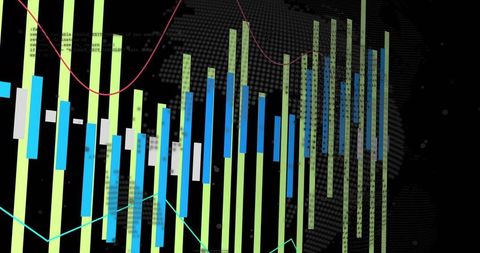
- Dynamic Financial Data and Analytics Visual on Digital Screen
Dynamic Financial Data and Analytics Visual on Digital Screen Image
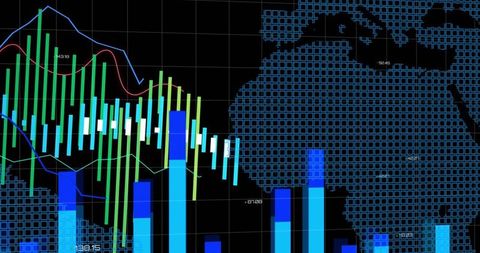
This image of dynamic financial charts showcases various data visualization formats like candlestick bars, bar columns, and line graphs on a digital screen. It highlights concepts of financial analytics and descriptive data, suitable for use in business, economic presentations, stock market reports, financial analysis brochures, and technology-focused articles.
Powered by  - Get 15% off with code: PIKWIZARD15


downloads
Tags:
More
Credit Photo
If you would like to credit the Photo, here are some ways you can do so
Text Link
photo Link
<span class="text-link">
<span>
<a target="_blank" href=https://pikwizard.com/photo/dynamic-financial-data-and-analytics-visual-on-digital-screen/538c2b05aa958756b759d3a2c0ab1808/>PikWizard</a>
</span>
</span>
<span class="image-link">
<span
style="margin: 0 0 20px 0; display: inline-block; vertical-align: middle; width: 100%;"
>
<a
target="_blank"
href="https://pikwizard.com/photo/dynamic-financial-data-and-analytics-visual-on-digital-screen/538c2b05aa958756b759d3a2c0ab1808/"
style="text-decoration: none; font-size: 10px; margin: 0;"
>
<img src="https://pikwizard.com/pw/medium/538c2b05aa958756b759d3a2c0ab1808.jpg" style="margin: 0; width: 100%;" alt="" />
<p style="font-size: 12px; margin: 0;">PikWizard</p>
</a>
</span>
</span>
Free (free of charge)
Free for personal and commercial use.
Author: Authentic Images
Similar Free Stock Images

Premium


Premium


Premium


Premium


Premium


Premium


Premium


Premium

Premium


Premium


Premium


Premium


Premium


Premium


Premium


Premium


Premium


Premium


Premium


Premium


Premium


Premium

Premium


Premium


Premium


Explore More Free Stock Images