
- Home >
- Stock Photos >
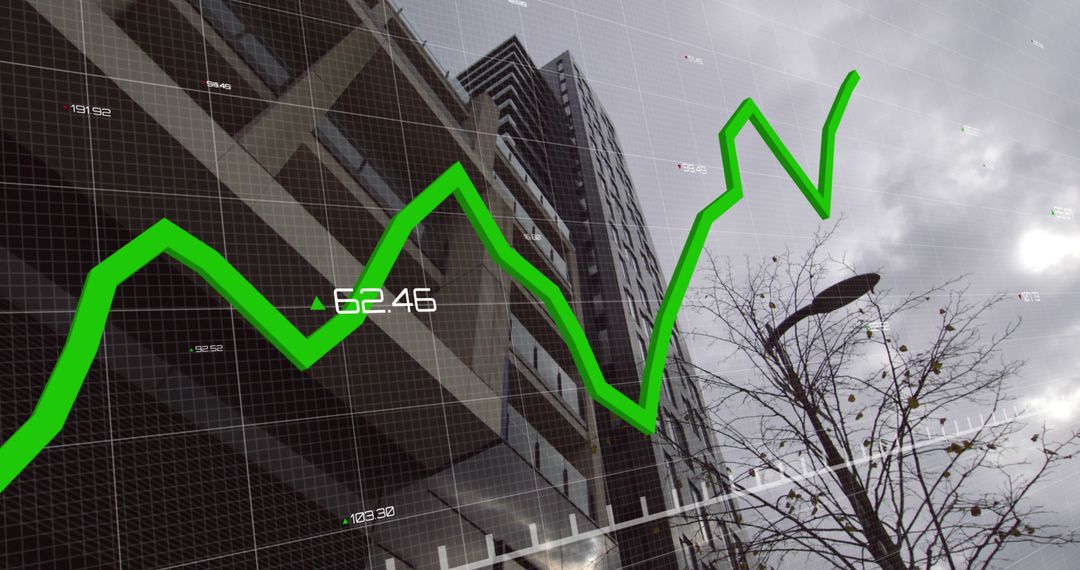
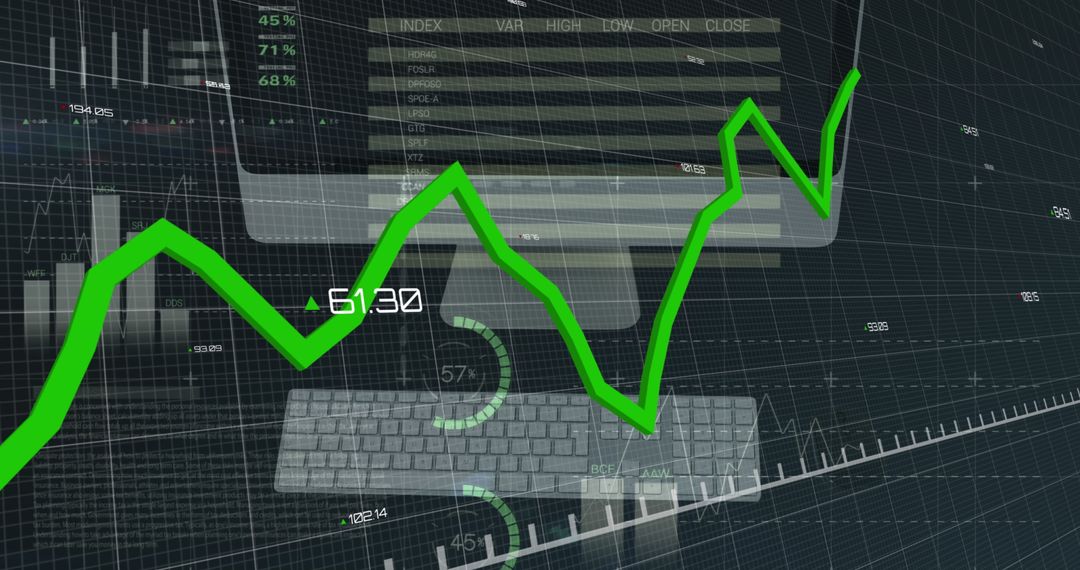
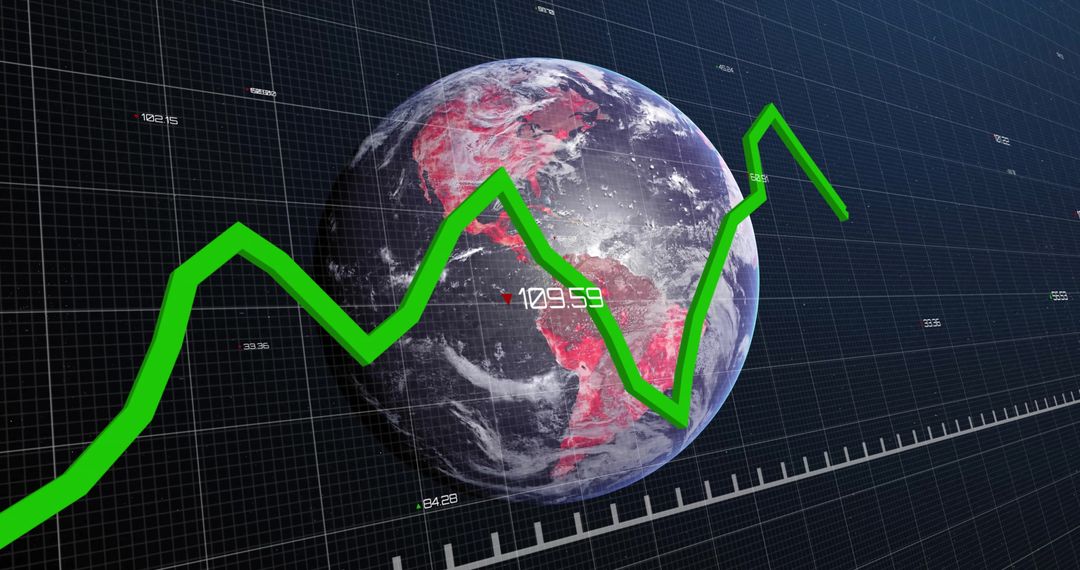
- Dynamic Financial Data and Analytics with Euro Symbol
Dynamic Financial Data and Analytics with Euro Symbol Image

Illustrates complex financial and data processing themes, featuring a prominent green graph line and an integrated euro symbol over a digital grid background. Useful for content related to finance, stock market analysis, global business strategies, data-driven decision making, and insights into economic fluctuations. Ideal for use in financial articles, presentations, technology industry reports, and educational materials addressing digital and economic data visualization.
Powered by  - Get 15% off with code: PIKWIZARD15


2
downloads
downloads
Tags:
More
Credit Photo
If you would like to credit the Photo, here are some ways you can do so
Text Link
photo Link
<span class="text-link">
<span>
<a target="_blank" href=https://pikwizard.com/photo/dynamic-financial-data-and-analytics-with-euro-symbol/947b474bff5f06b33019298b249ee89e/>PikWizard</a>
</span>
</span>
<span class="image-link">
<span
style="margin: 0 0 20px 0; display: inline-block; vertical-align: middle; width: 100%;"
>
<a
target="_blank"
href="https://pikwizard.com/photo/dynamic-financial-data-and-analytics-with-euro-symbol/947b474bff5f06b33019298b249ee89e/"
style="text-decoration: none; font-size: 10px; margin: 0;"
>
<img src="https://pikwizard.com/pw/medium/947b474bff5f06b33019298b249ee89e.jpg" style="margin: 0; width: 100%;" alt="" />
<p style="font-size: 12px; margin: 0;">PikWizard</p>
</a>
</span>
</span>
Free (free of charge)
Free for personal and commercial use.
Author: Creative Art
Similar Free Stock Images

Premium


Premium


Premium


Premium


Premium


Premium


Premium


Premium


Premium


Premium


Premium


Premium


Premium


Premium


Premium


Premium


Premium


Premium


Premium


Premium


Premium


Premium


Premium


Premium

