- Home >
- Stock Photos >
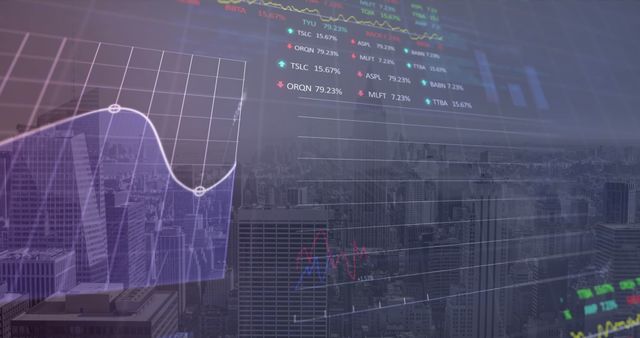
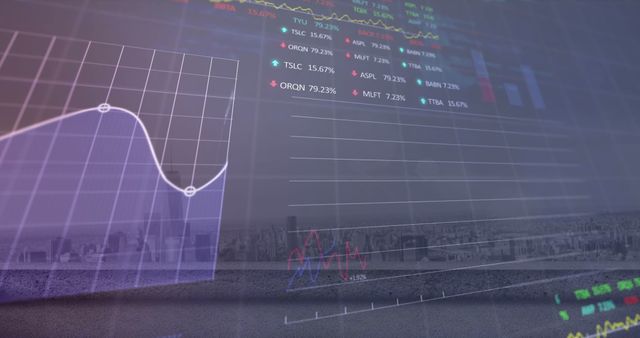
- Dynamic Financial Data and Graph Arrows in Digital Interface
Dynamic Financial Data and Graph Arrows in Digital Interface Image

This visualization offers a detailed glance into the intricate world of financial data processing and global trading dynamics. Featuring arrows indicating trends and varying data points illustrated through graphs, it captures the essence of modern finance and investment strategy. Ideal for illustrating concepts related to trading technologies, analytics in business reports, financial publications, or presentations on finance-related topics.

downloads
Tags:
More
Credit Photo
If you would like to credit the Photo, here are some ways you can do so
Text Link
photo Link
<span class="text-link">
<span>
<a target="_blank" href=https://pikwizard.com/photo/dynamic-financial-data-and-graph-arrows-in-digital-interface/db74a7291a1f071116a4f07b666a8900/>PikWizard</a>
</span>
</span>
<span class="image-link">
<span
style="margin: 0 0 20px 0; display: inline-block; vertical-align: middle; width: 100%;"
>
<a
target="_blank"
href="https://pikwizard.com/photo/dynamic-financial-data-and-graph-arrows-in-digital-interface/db74a7291a1f071116a4f07b666a8900/"
style="text-decoration: none; font-size: 10px; margin: 0;"
>
<img src="https://pikwizard.com/pw/medium/db74a7291a1f071116a4f07b666a8900.jpg" style="margin: 0; width: 100%;" alt="" />
<p style="font-size: 12px; margin: 0;">PikWizard</p>
</a>
</span>
</span>
Free (free of charge)
Free for personal and commercial use.
Author: Awesome Content