- Home >
- Stock Photos >
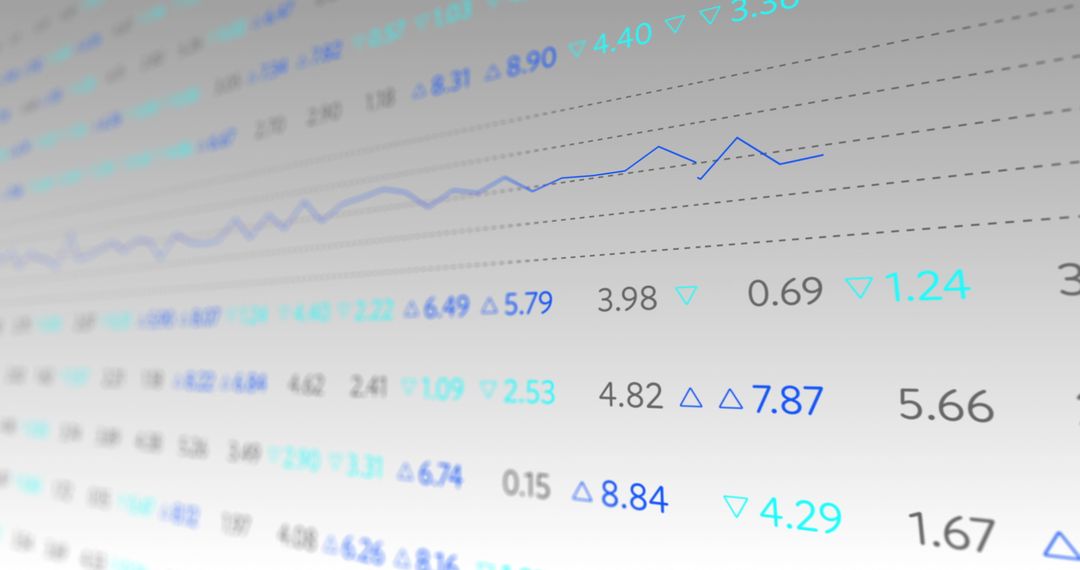
- Dynamic Financial Data and Graphs Over Virtual Blue Background
Dynamic Financial Data and Graphs Over Virtual Blue Background Image

Visual representation of digital financial data and graphs set against a virtual blue backdrop, conveying concepts of global business and technology. Ideal for illustrating financial reports, stock market updates, economic trends, tech business solutions, and investment strategies in both digital and print media.
Powered by 


2
downloads
downloads
Tags:
More
Credit Photo
If you would like to credit the Photo, here are some ways you can do so
Text Link
photo Link
<span class="text-link">
<span>
<a target="_blank" href=https://pikwizard.com/photo/dynamic-financial-data-and-graphs-over-virtual-blue-background/92730fcc471ad72bea13a4c7bdf5306b/>PikWizard</a>
</span>
</span>
<span class="image-link">
<span
style="margin: 0 0 20px 0; display: inline-block; vertical-align: middle; width: 100%;"
>
<a
target="_blank"
href="https://pikwizard.com/photo/dynamic-financial-data-and-graphs-over-virtual-blue-background/92730fcc471ad72bea13a4c7bdf5306b/"
style="text-decoration: none; font-size: 10px; margin: 0;"
>
<img src="https://pikwizard.com/pw/medium/92730fcc471ad72bea13a4c7bdf5306b.jpg" style="margin: 0; width: 100%;" alt="" />
<p style="font-size: 12px; margin: 0;">PikWizard</p>
</a>
</span>
</span>
Free (free of charge)
Free for personal and commercial use.
Author: Awesome Content
Similar Free Stock Images

Premium


Premium


Premium


Premium


Premium


Premium


Premium


Premium


Premium


Premium


Premium


Premium


Premium


Premium


Premium


Premium


Premium


Premium


Premium


Premium


Premium


Premium


Premium


Premium