
- Home >
- Stock Photos >
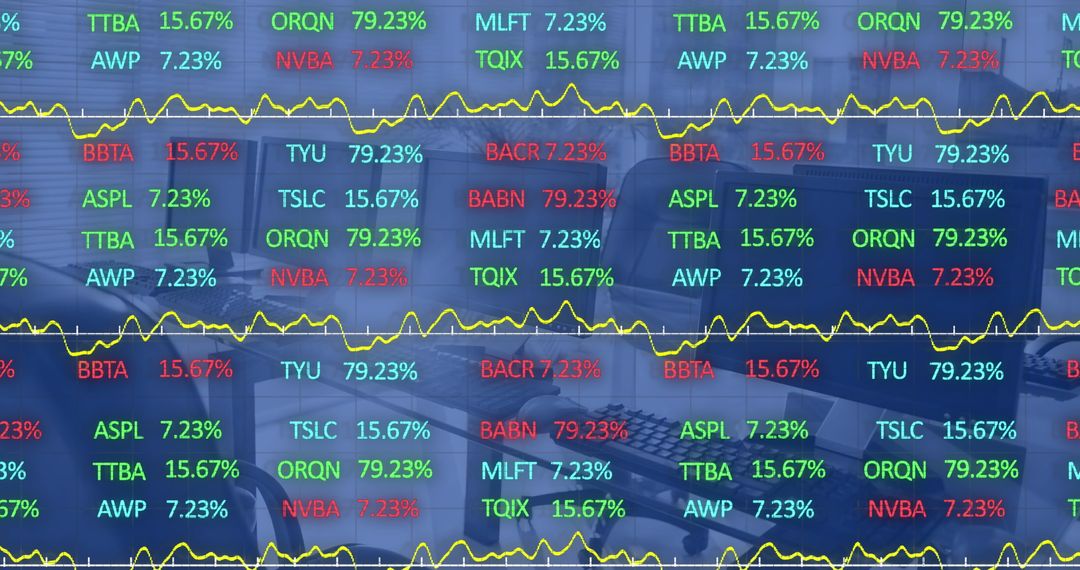
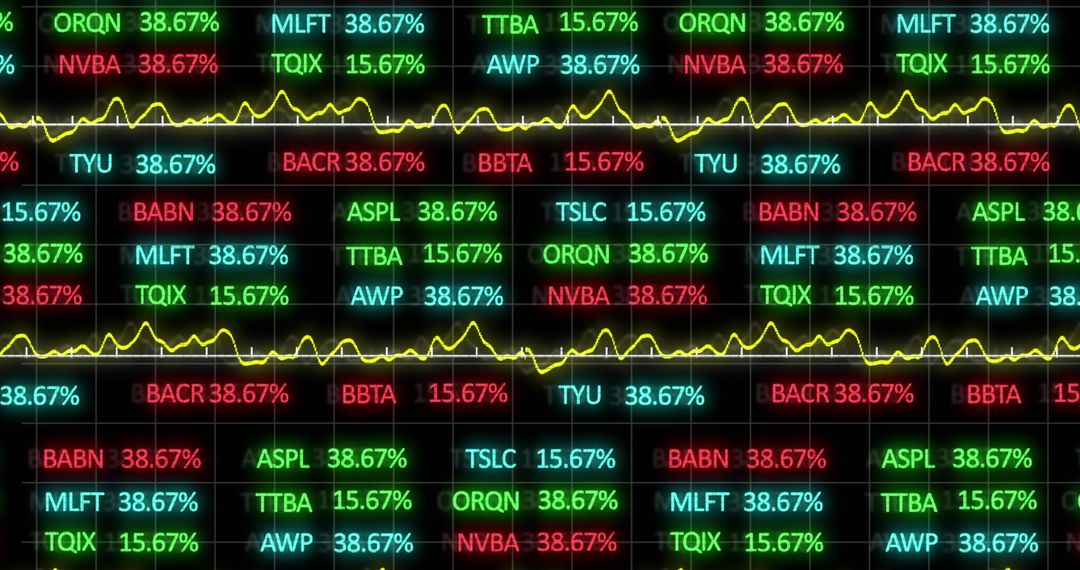
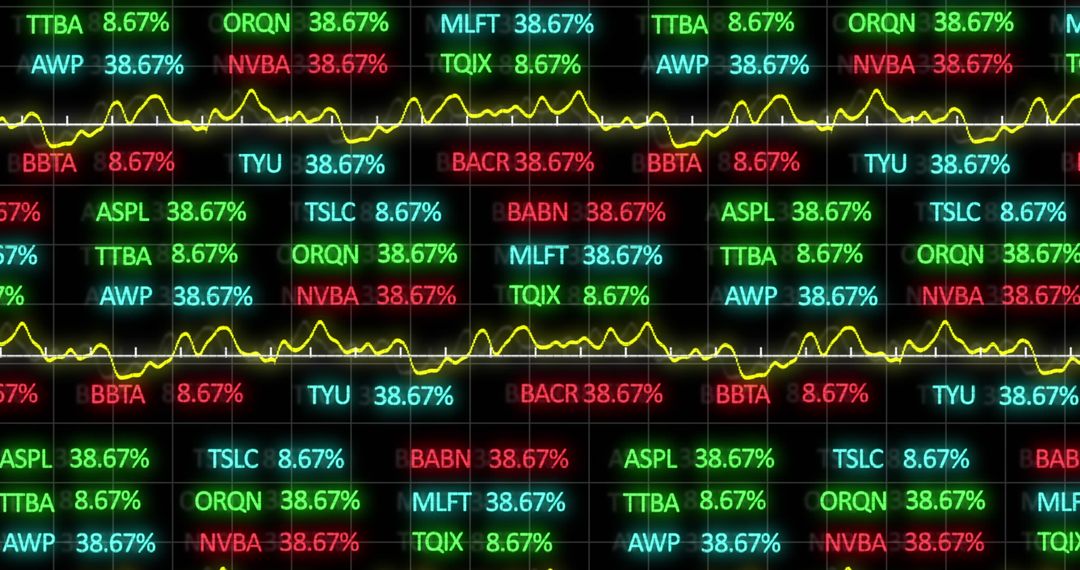
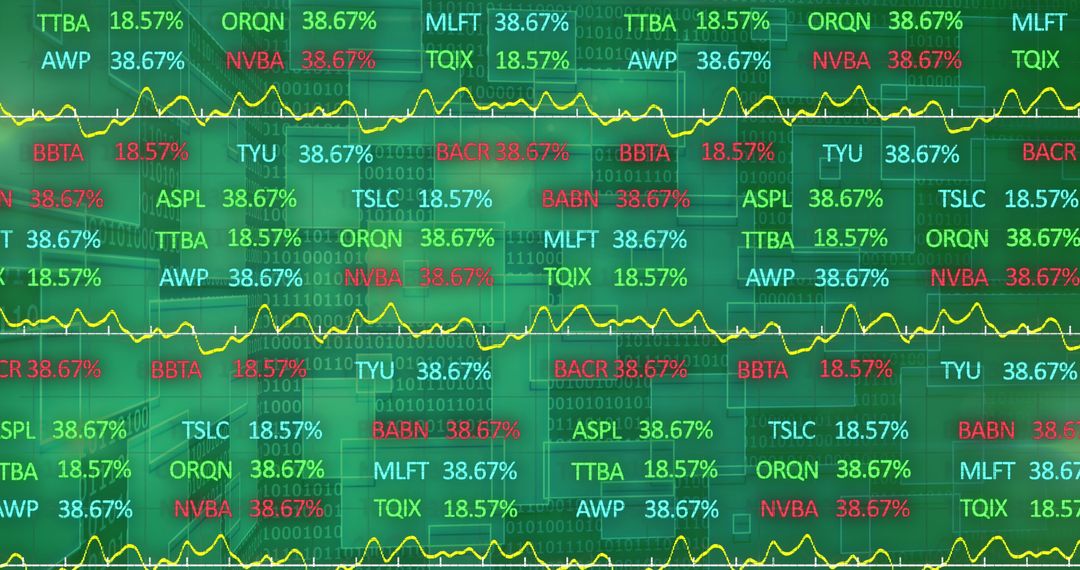
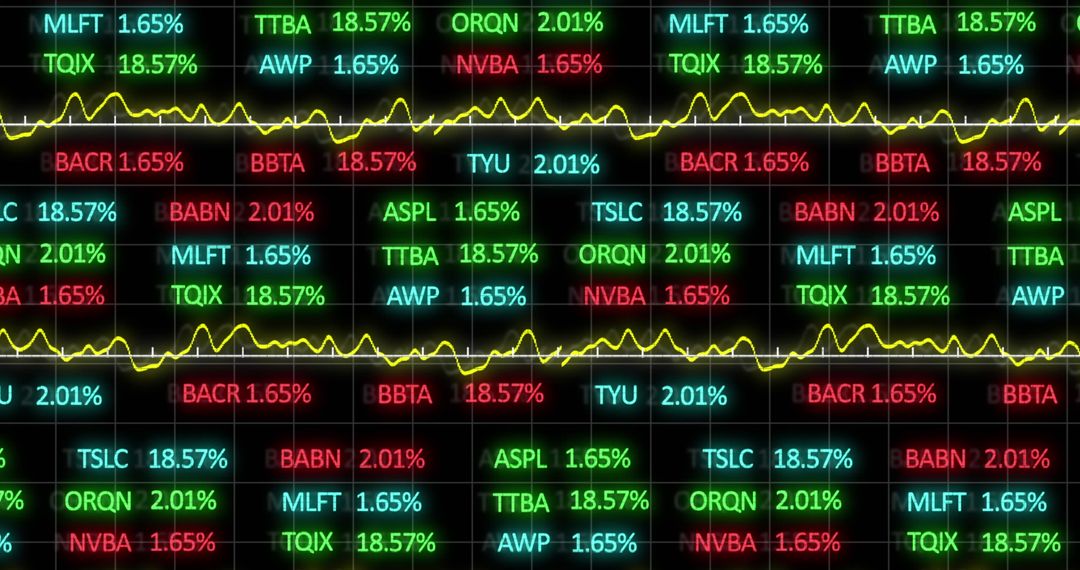
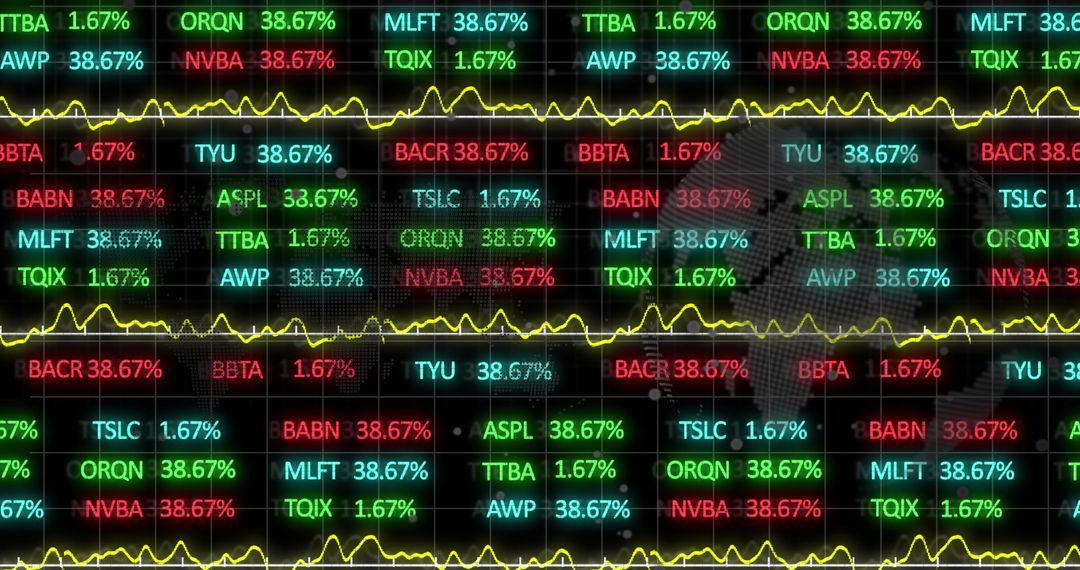
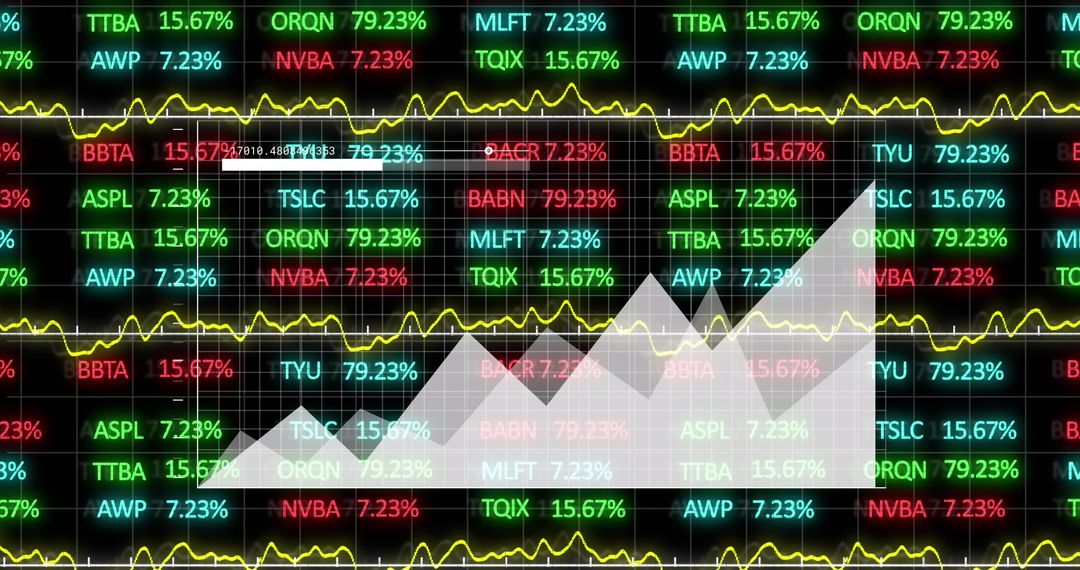
- Dynamic Financial Data and Growth Arrows in Stock Market Display
Dynamic Financial Data and Growth Arrows in Stock Market Display Image
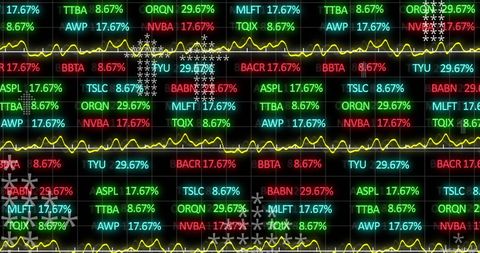
Overlapping growth and data graphics suggest themes of business intelligence and financial analysis. Common uses include economic reports, stock market updates, investment analysis, and business strategy presentations.
Powered by  - Get 15% off with code: PIKWIZARD15


2
downloads
downloads
Tags:
More
Credit Photo
If you would like to credit the Photo, here are some ways you can do so
Text Link
photo Link
<span class="text-link">
<span>
<a target="_blank" href=https://pikwizard.com/photo/dynamic-financial-data-and-growth-arrows-in-stock-market-display/f024c0f3287bc695e96ac892ac3a64bc/>PikWizard</a>
</span>
</span>
<span class="image-link">
<span
style="margin: 0 0 20px 0; display: inline-block; vertical-align: middle; width: 100%;"
>
<a
target="_blank"
href="https://pikwizard.com/photo/dynamic-financial-data-and-growth-arrows-in-stock-market-display/f024c0f3287bc695e96ac892ac3a64bc/"
style="text-decoration: none; font-size: 10px; margin: 0;"
>
<img src="https://pikwizard.com/pw/medium/f024c0f3287bc695e96ac892ac3a64bc.jpg" style="margin: 0; width: 100%;" alt="" />
<p style="font-size: 12px; margin: 0;">PikWizard</p>
</a>
</span>
</span>
Free (free of charge)
Free for personal and commercial use.
Author: People Creations
Similar Free Stock Images

Premium


Premium


Premium


Premium


Premium


Premium


Premium


Premium


Premium


Premium


Premium


Premium


Premium


Premium


Premium


Premium


Premium


Premium


Premium


Premium


Premium


Premium


Premium


Premium

