1. Home > 
  2. Stock Photos > 
  3. Dynamic Financial Data and Network Visualization Background

Dynamic Financial Data and Network Visualization Background Image

Dynamic Financial Data and Network Visualization Background

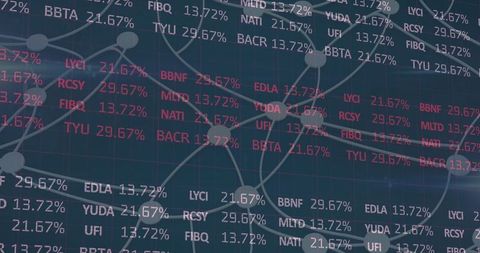
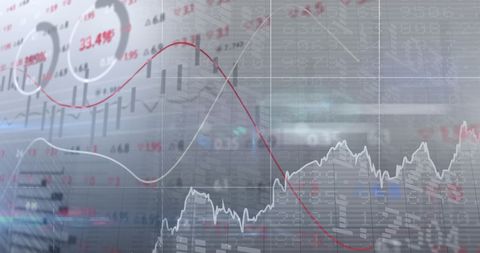
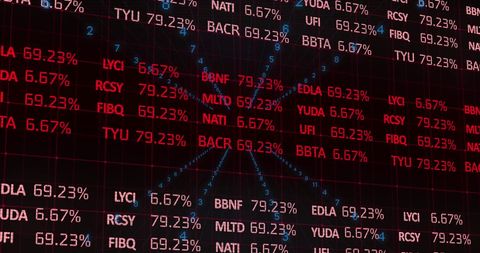
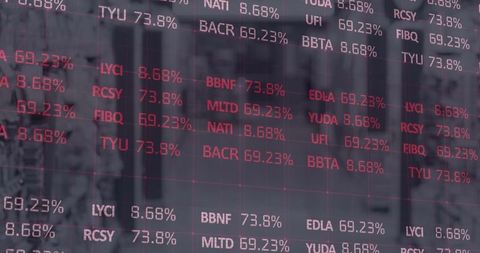
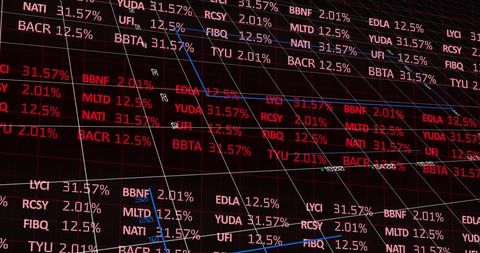
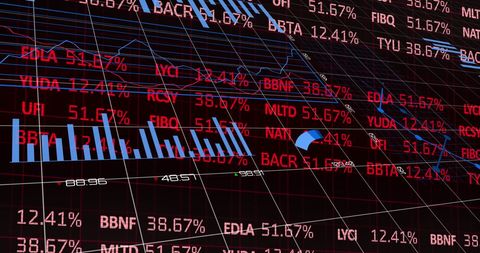
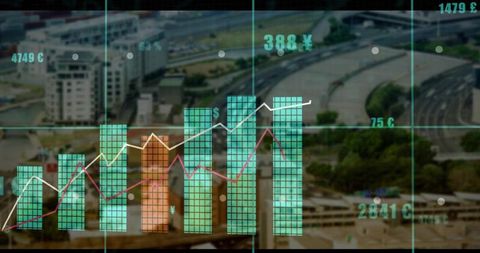
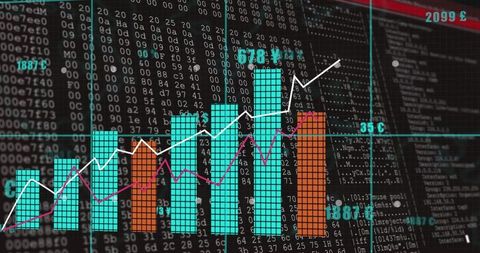
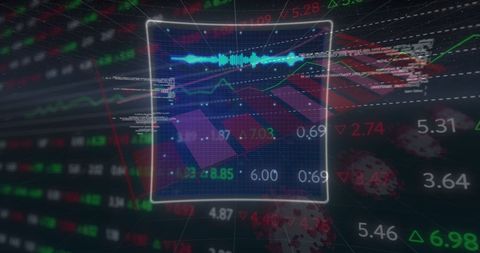
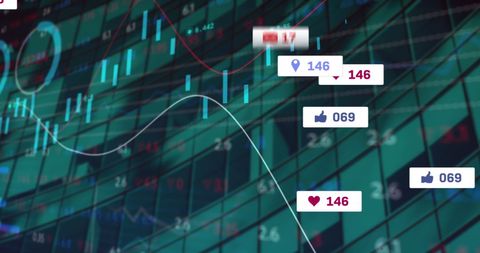
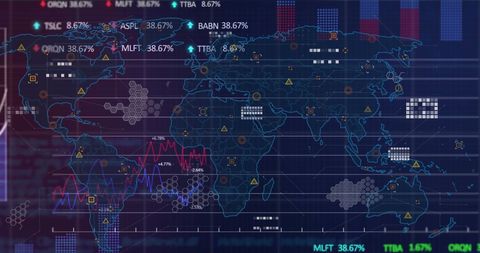
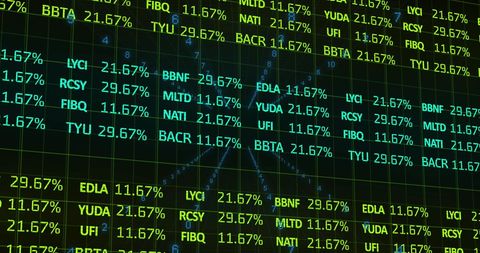
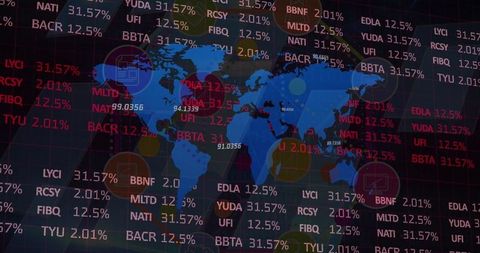
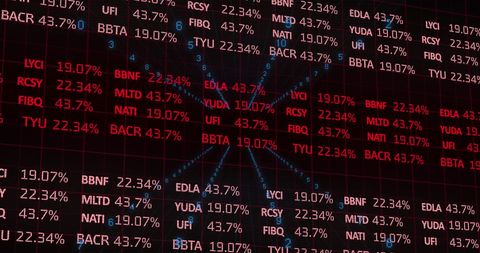
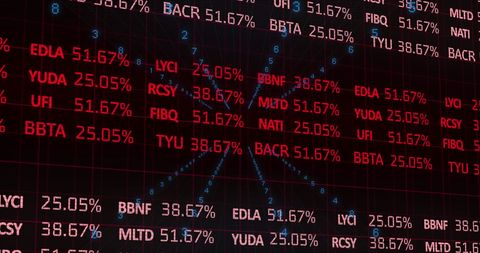
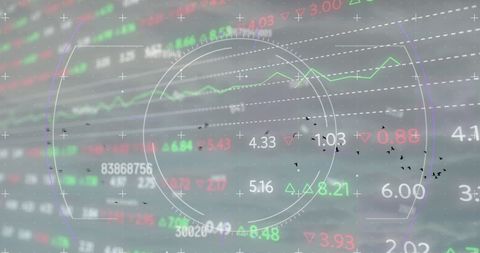
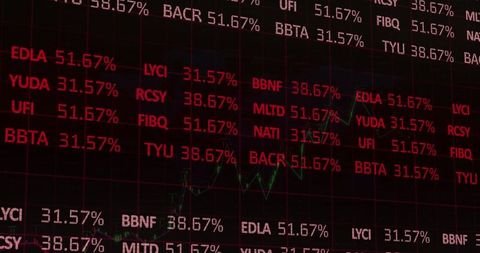
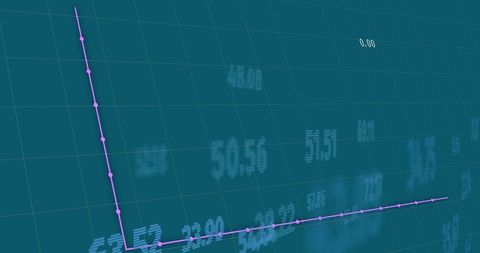
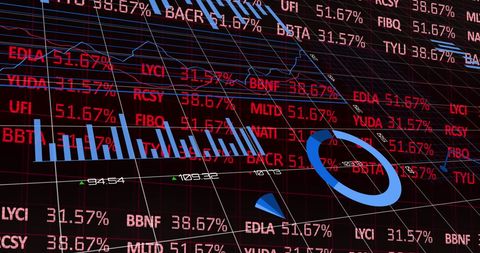
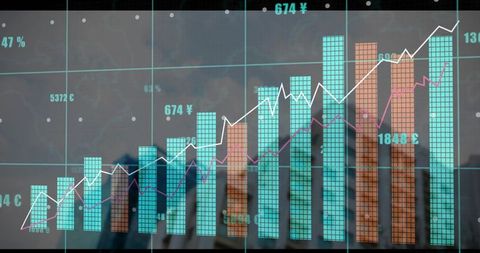
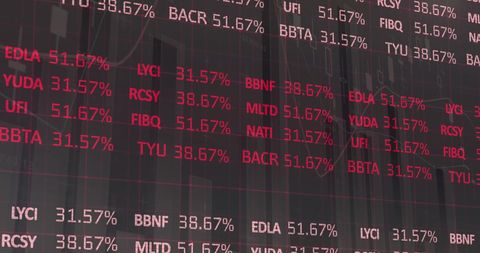
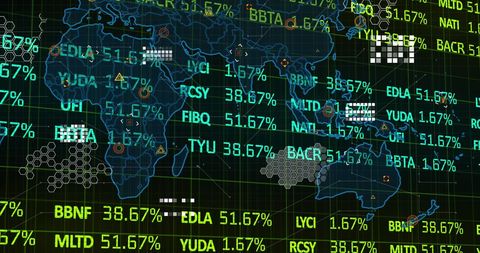
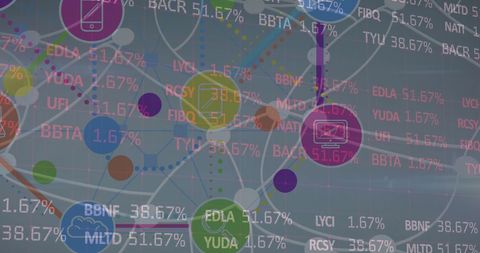
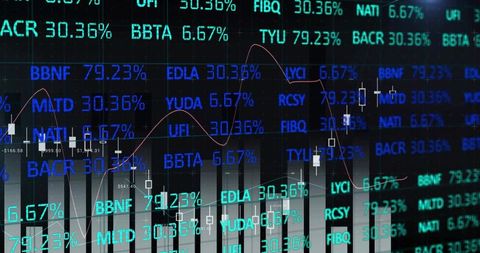
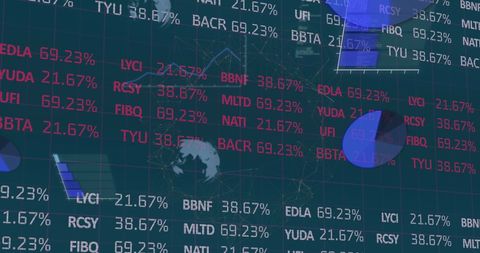
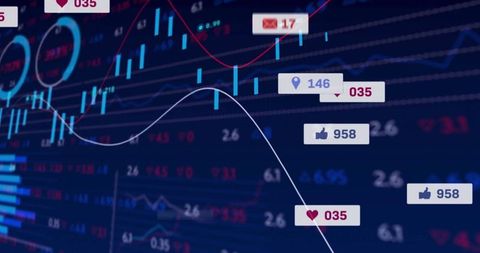
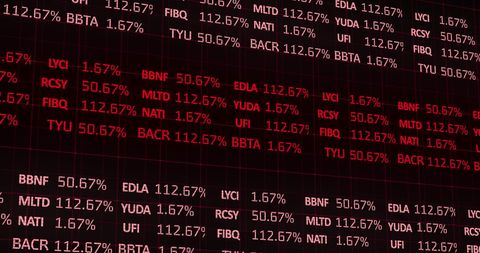
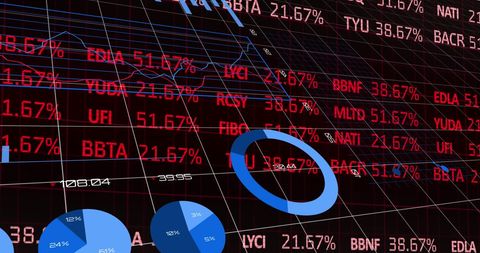
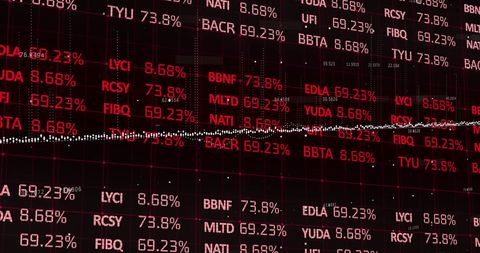
This image illustrates the complex and dynamic visualization of financial statistics overlaying a backdrop of interconnected networks, representing global technological and business trends. It is useful for presentations on financial markets, digital analytics tools, economic report designs, technology seminars, and business analytics interfaces.

Powered by Shutterstock logo - Get 15% off with code: PIKWIZARD15
Big data analytics with AI technology. Data analyst analyzing and visualizing complex information network with artificial intelligence. Machine learning algorithm for business analytics and finance. - Powered by Shutterstock - Get 15% off with code: PIKWIZARD15Scientist working with business data, finance, marketing report, Big Data Analytics technology, Processing Complexity information flow on virtual screen, machine learning, artificial intelligence, ML - Powered by Shutterstock - Get 15% off with code: PIKWIZARD15Using tablet pc, Consultant between bookkeepers and accounting lawyer consultation about asset, balance sheet, stock market statistics and yearly tax law, protect business from bribery. - Powered by Shutterstock - Get 15% off with code: PIKWIZARD15Businessman analyze and visualize complex information on a virtual screen using AI to process data. Big data technology and data science.Data flow.Digital neural network.artificial intelligence - Powered by Shutterstock - Get 15% off with code: PIKWIZARD15Risk Management Work process.Picture Trader working Market Report Document Touching Screen Tablet.Using Worldwide Graphic Icons,Stock Exchange Report.Business Project Startup.Horizontal,Flares Effect - Powered by Shutterstock - Get 15% off with code: PIKWIZARD15

Credit Photo

If you would like to credit the Photo, here are some ways you can do so

Free (free of charge)

Free for personal and commercial use.

Author: Awesome Content

Similar Free Stock Images

Digital Stock Market Data Display on Screen
Premium
Man look at the dashboard with graphs and charts. Concept of data management system, business intelligence, data statistics, marketing analysis, key performance indicators (KPI) and analytics.
Digital Data Processing with Graphs and Numbers
Financial Digital Display with Stock Market Indices and Analytics
Global Financial Markets Overlaid on World Map Showcasing Stock Data
Abstract Stock Market Data with Financial Graphs and Charts
Premium
Image of statistical and stock market data processing against view of tall buildings. Global economy and business data technology concept
Digital Financial Data Graph with Statistics and Figures
Dynamic Financial Data Visualization with Stock Market Indicators
Global Financial Data Analytics with World Map
Dynamic Financial Data on Digital Interface
Premium
Big data and AI technology, Business intelligence and AI data science, Automating data processing, Machine learning and business intelligence, AI driven data processing, KPI performance monitoring.
Digital Data Grid with Financial Symbols Illustrating Economy
Dynamic Stock Market Data with Digital Analysis Grid Concept
Global Financial Data with Renewable Energy Concept
Abstract Digital Data with Computer Code Visualization
Premium
Image of financial data processing over dark background. global connections, data processing and digital interface concept digitally generated image.
Digital Data Visualization with Colorful Network Connections
Abstract Financial Data Visual with Graph on Blue Background
Digital Binary Code with Financial Data Representation
Financial Data Processing with Global Network Connections Concept
Premium
Finance marketing research reports paper close up, economic sales statistics documents lying on office desk, business people planning organization process
Digital Network Interface Over Data Processing Display
Futuristic Global Finance Data Grid with Illuminated Metrics
Hacker Breaching Network Computer Code Interface
Abstract Global Business Data Interface Background
Premium
Businesswoman working with business data, finance, marketing report, Big Data Analytics technology, Processing Complexity information flow on virtual screen, machine learning, artificial intelligence.
Digital Code Display on Screen with Grid Interface
Futuristic Digital Network with Data Cluster Visualization
Financial Dashboard with Candlestick Chart and Notifications
Business Colleagues Analyzing Financial Data Visualization Charts
Conceptual Finance Data on Empty Office Desk
Digital Interface with Real-Time Financial Data Analytics
Premium
Man look at the dashboard with graphs and charts. Concept of data management system, business intelligence, data statistics, marketing analysis, key performance indicators (KPI) and analytics.
Dynamic Stock Market Charts with Financial Data
Dynamic Stock Market Data with Futuristic Interface Overlay
Data Analytics and Stock Market Trends on Digital Display
Financial Data over Cityscape Illustrates Economic Trends
Premium
Image of financial data processing over diverse business people in office. Global finance, business, connections, computing and data processing concept digitally generated image.
Dynamic Financial Data Display with Red Statistics on Black Background
Global Financial Data Display with World Map Background
Financial Data Processing Over Technology Grid
Digital Data Processing Overlay on Dynamic Cityscape
Premium
Back rear view of young asian woman, freelance data scientist work remotely at home coding programmer on Big data mining, AI data engineering, IT Technician Works on Artificial Intelligence Project.
Social Media Notifications on Stock Market Graph Overlay
Futuristic Digital City Overlay on Data Matrix Background
Financial Data Visualization on Digital Grid Backdrop
Dynamic Financial Data Visualization Illustrating Global Markets
Premium
office document auditing concept ,plan review process and assess correctness ,Management of important document storage of organization ,document system ,accountant Audit documents
Global Stock Market Trends Over Digital World Map
Global Stock Market Data with Overlaid Analytics
Digital Financial Growth with Rising Bar and Line Graphs
Global Financial Data Algorithms on Digital Interface
Premium
Data analysis science and big data with AI technology. Analyst or Scientist uses a computer and dashboard for analysis of information on complex data sets on computer. Insights development engineer
Stock Market Data Visualization on Overlay Screen
Game Controller Icon over Complex Data Analytics Interface
Global Data Visualization on Dark Background for Financial Insights
Dynamic Financial Data Analysis with Futuristic Graphs
Premium
Photo working process.Finance trade manager showing reports screen.Young business crew work with startup project modern office.Desktop computers on table, presentation new idea.Film effect.Horizontal.
Complex Data Visualization on Digital Dashboard Interface
3D Financial Charts Overlay on Urban Landscape for Data Infographics
Digital Financial Market Display with Candlestick Analysis
Stock Market Data with Digital Financial Graphs
Digital Network Connections Overlaying Data Processing Screen
Digital Stock Market Data and Statistical Analysis Background
Premium
Man Typing Keyboard Laptop Hand.Project Manager Researching Process.Business Team Working Startup modern Office.Global Strategy Virtual Icon.Innovation Graphs Interfaces.Analyze market stock.Blurred
Digital Stock Market Data Visualization on Black Background
Dynamic Stock Market Analytics with High-Tech Data Visualization
Digital Interface Screen with Abstract Financial Data Overlay
Global Financial Data Visualization with World Map
Premium
Analytical data and development statistics. Web analytics and product testing techniques are being measured. A guy studies an SEO dashboard and a digital report.
Dynamic Stock Market Data Visualization Illustration
Financial Data Display Over City Landscape Silhouette
Global Digital Business Data with Futuristic Grid Overlay
Concept of Digital Data Processing and Online Security
Premium
Digital tablet showing charts
Stock Market Data Processing with Business Collaboration
Futuristic Financial Data Digital Display Background
Digital World Map Showcasing Global Financial Market Trends
Global Stock Market Data and Plexus Network Overlay
Premium
Accountant showing office document auditing concept ,plan review process and assess correctness ,Management of important document storage of organization ,document system ,accountant Audit documents
Digital Data Processing and Global Network Connections Visualization
Financial Data Visualization on Global Virtual Graph
Global Financial Trading Data with World Map Overlay
Digital Binary Matrix Over Global Sphere Illustrating Data Processing
Premium
business analytics intelligence concept, financial charts to analyze profit and finance performance of company
Digital Interface for Data Processing and Global Business Concepts
5G Innovation Concept with Stock Market and Digital Interface
Global Digital Networking with Binary Code and Data Grid Background
Abstract Cybersecurity Interface with Data Flow Visualization
Premium
Woman Touching Screen Electronic Tablet Hand.Project Managers Researching Process.Business Team Working New Startup modern Office.International Digital Diagrams Interfaces.Analyze market stock.Blurred
Digital Stock Market Display with Tickers and Graphs
Dynamic Financial Graphs with Candlestick Chart Overlay
Digital Coding with Security Alert on Screen
Analyzing Complex Financial Data on Transparent Screen
Data Processing Visual Over Modern Server Room
Global Stock Market Analysis Display with Red Data
Premium
Financial data on a monitor as Finance data concept. Analytics Report Status Information Analysis Chart Graph in digital screen. Business analyzing financial statistics displayed on the tablet screen.
Digital Stock Market Data with Graphs and Percentages
Rising Financial Graphs with Digital Data Interface
Digital Financial Data Display with Red and Blue Highlights
Financial Market Growth Trends Displayed Over World Map
Premium
Data analysis science and big data with AI technology. An analyst or Scientist uses a computer and dashboard to analyze information on complex data sets on a computer. Insights development engineer.
Digital Data Visualization with Red Analytics on Black Background
Global Financial Data Analysis with Digital Screen Interface
Global Stock Market Trading Hologram Displays Financial Data
Futuristic Financial Data Processing in Digital Interface
Premium
close up ceo businesswoman hand point on dashboard screen tablet device for ask and share idea or consulting with businessman partner for business team and work from home concept
Financial Data Visualization with Team Collaboration in Modern Office
Global Financial Data Processing and Stock Market Interface
Abstract Digital Data Stream and Error Codes
Futuristic Circuit Board with Digital Financial Data Overlay
Premium
Executive business team people group working with paperwork standing at table, analyzing corporate strategy concept, reviewing plan, managing financial project overview at office meeting, close up.
Global Financial Data Processing Interface with Analytics
Global Financial Data Processing Overlay on World Map
Digital Encryption Interface with Data Networks
Fluctuating Stock Market Graph with Red Numerical Data
Premium
Accountant manages and examines office documents ,accounting documents ,Reports for Tax Time Analysis ,plan review process and assess correctness ,business document evaluation process
Futuristic Financial Data Visualization with Radar Interface
Holographic Financial Data Interfaces in Server Environment
Digital Waveform Display with Error Codes in Terminal Interface
Futuristic World Map with Digital Data Overlay for Analytics
Premium
Photo team work process,holding contract hand,signs documents. Account managers young crew works with startup project.New idea presentation, analyze marketing reports. Blurred, film effect, horizontal
Multilayer Trading Dashboard Overlaying Code Editor, Candlestick Charts and Visualizations