
- Home >
- Stock Photos >
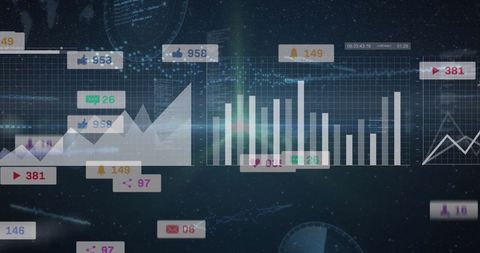
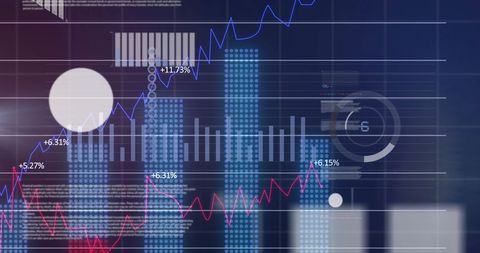
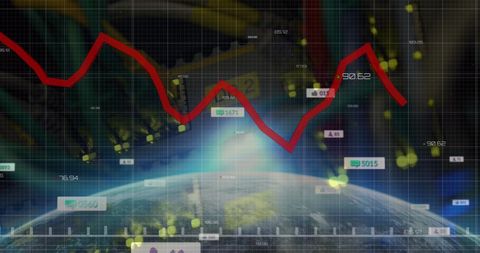
- Dynamic Financial Data and Progress Chart Display
Dynamic Financial Data and Progress Chart Display Image

This visual representation of multiple financial metrics and progress indicators uses holographic technology to display dynamic data. Indicators such as numbers, bar graphs, and charts illustrate business growth opportunities. Suitable for use in financial reports, presentations on digital technology, stock market analytics, and educational contexts about economic trends.
Powered by 


downloads
Tags:
More
Credit Photo
If you would like to credit the Photo, here are some ways you can do so
Text Link
photo Link
<span class="text-link">
<span>
<a target="_blank" href=https://pikwizard.com/photo/dynamic-financial-data-and-progress-chart-display/1c387851abc189640a3740a0b9c90a68/>PikWizard</a>
</span>
</span>
<span class="image-link">
<span
style="margin: 0 0 20px 0; display: inline-block; vertical-align: middle; width: 100%;"
>
<a
target="_blank"
href="https://pikwizard.com/photo/dynamic-financial-data-and-progress-chart-display/1c387851abc189640a3740a0b9c90a68/"
style="text-decoration: none; font-size: 10px; margin: 0;"
>
<img src="https://pikwizard.com/pw/medium/1c387851abc189640a3740a0b9c90a68.jpg" style="margin: 0; width: 100%;" alt="" />
<p style="font-size: 12px; margin: 0;">PikWizard</p>
</a>
</span>
</span>
Free (free of charge)
Free for personal and commercial use.
Author: People Creations
Similar Free Stock Images

Premium


Premium

Premium


Premium


Premium


Premium


Premium

Premium


Premium


Premium

Premium


Premium


Premium


Premium


Premium


Premium


Premium


Premium


Premium


Premium


Premium


Premium

Premium


Premium


Premium


Explore More Free Stock Images